Topics
References
-
Status of Facilities Competition in G7 Countries
-
Major Telecommunications Carriers' Revenues
-
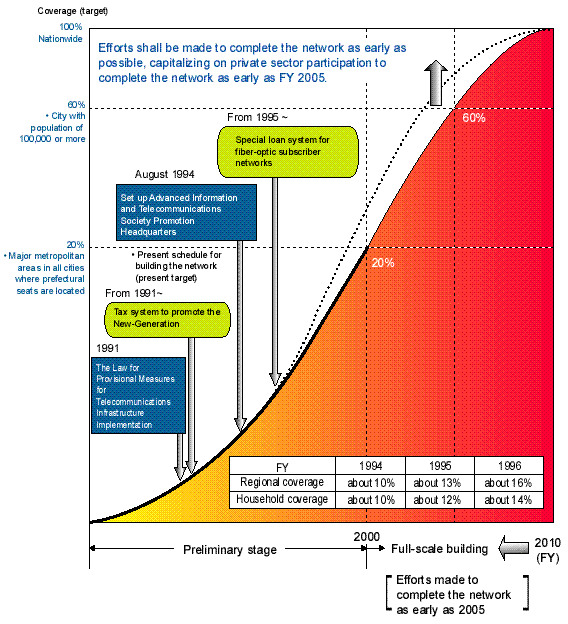
Construction of Fiber-optic Network
-
Schedule for Construction of Fiber-optic Network
-
Support for Implementation of Fiber-optic Network
-
Activation of Telecommunications Equipment Market
-
International Procurement Amounts of Type I
Telecommunications Carriers
-
Trends in Technology Trade
-
Current Status of Broadcasting Business in Japan
| Reference 1. |
Status of Facilities Competition in G7 Countries
|
1) 1993
Source:OECD Communications Outlook (1997)
|
Country
Classification
|
Japan |
U.S. |
U.K. |
Canada |
France |
Germany |
Italy |
Public switched
telephone
network
|
Local |
C |
C |
C |
C |
1998 |
1998 |
1998 |
| Trunk |
C |
C |
C |
C |
1998 |
1998 |
1998 |
| International |
C |
C |
C |
M |
1998 |
1998 |
1998 |
Data communi-
cations and
Leased circuits
|
X.25 |
C |
C |
C |
C |
C |
C |
1998 |
| LLs |
C |
C |
C |
C |
C |
C |
1998 |
Mobile
communi-
cations
|
Analog cellular |
C |
C |
C |
RD |
RD |
M |
M |
| Digital cellular |
C |
C |
C |
C |
C |
C |
RD |
| Radio paging |
C |
C |
C |
C |
C |
C |
- |
Number of mobile carriers
within the same market
|
7 |
up to 8 |
4 |
4 |
3 |
3 |
2 |
| C |
Competition |
| PC |
Partial competition
(e.g. Limited to certain areas)
|
| D |
Duopoly |
| RD |
Regionalized Duopoly |
| 1998 |
(Competition expected to be) |
| M |
Monopoly |
| Reference 2. |
Major Telecommunications Carriers' Revenues |
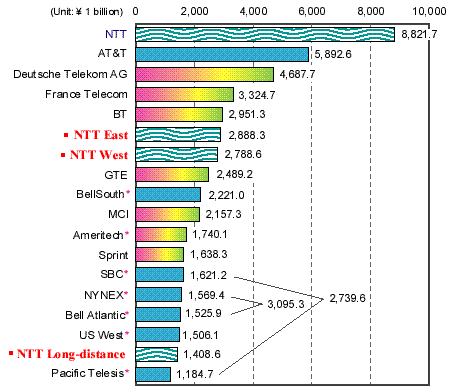
Notes:
- 1.
- Comparison based on operating revenues (sales) figure for FY 1996
- 1)
- For NTT, data are based on figures for FY 1996 financial results.
- 2)
- For AT&T, data used are for operating revenues from
telecommunications services.
- 3)
- For all companies including NTT, data used are for consolidated
revenues. For NTT alone, revenues were 6,371.2 billion yen.
- 4)
- NTT East figure comprises combined revenues for Hokkaido, Tohoku,
Kanto, Tokyo and Shinetsu regional divisions. NTT West figure comprises
combined revenues for Tokai, Hokuriku, Kansai, Chugoku, Shikoku and
Kyushu regional divisions.
- 5)
- Figure for NTT Long-distance indicates revenues for long-distance
division.
- 2.
- Exchange rate to Japanese yen used is the closing rate on January 6,1997. (US Dollar 1=116.65 yen; DM1=74.29 yen; FF 1=21.98 yen; Pound sterling 1=197.61 yen; Canadian Dollar=85.11 yen)
- 3.
- "*" are 7 RHCs (Regional Holding Companies) in the U.S.
- 4.
- SBC and Pacific Telesis were merged on April 1, 1997.
- 5.
- Bell Atlantic and NYNEX were merged on August 15, 1997.
| Reference 3. |
Construction of Fiber-optic Network |
1)Installation conditions in terms of cable length used
(As of the end of FY96; unit:1,000 km)
| Item |
Cable length |
Fiber-optic cable (ratio) |
| Transit System |
291.6 |
191.9 (66%) |
Subscriber Loop
System
|
1,106.1 |
107.1 (9.7%) |
| Total |
1,397.7 |
299.0 (21.4%) |
2)Change in usage rate of fiber-optic cables (cable length)
(Unit: %)
| Item |
FY89 |
FY90 |
FY91 |
FY92 |
FY93 |
FY94 |
FY95 |
FY96 |
| Transit System |
- |
- |
36 |
42 |
48 |
55 |
60 |
66 |
| Subscriber Loop System |
- |
- |
2.3 |
2.9 |
3.8 |
4.7 |
6.4 |
9.7 |
| Total |
4.9 |
6.7 |
8.6 |
10.1 |
12.4 |
15.1 |
17.3 |
21.4 |
3)Investment in fiber-optic networks
(unit: 1 billion yen)
| End of Fiscal Year |
FY1994 |
FY1995 |
FY1996 |
| Transit System |
341.4 |
297.2 |
338.7 |
Subscriber Loop
System
|
129.9 |
244.7 |
331.5 |
| Total |
471.3 |
541.9 |
670.2 |
| Reference 4. |
Schedule for Construction of Fiber-optic Network |
| Reference 5. |
Support for Implementation of Fiber-optic Network |
|
To receive the following support, applicants should obtain authorization of construction plans from MPT in line with the Law for provisional Measures for Telecommunications Infrastructure Implementation.
|
Special Loan System for the Implementation of
Subscriber Fiber-Optic Network
|
A subsidy for loan interest from the
Telecommunications Advancement Organization of Japan
can be used to supplement interest payments on NTT-C'
loans (long-term 15-year loans ) for Type I
telecommunications carriers and cable TV operators.
The aforementioned loans are provided by the Japan
Development Bank and others, based on the Special
Measures Law for Development of Social Infrastructure.
The subsidy covers up to 2% of the loan interest,
while the minimum interest rate after subsidization
is set at 2% for the first five years and 2.5% after
that.
Application of special depreciation of
corporate tax
Benefits of special depreciation of the
corporate tax (Transit system : 7%, Subscriber loop
system : 8% in FY 1998) can be applied for by Type I
carriers intending to implement subscriber fiber-optic
networks.
Reduction of the taxation standard for fixed property
tax (1/4 reduction in FY 1998) can be applied for by
Type I carriers intending to implement subscriber
fiber-optic networks.
| Reference 6. |
Activation of Telecommunications Equipment Market |
- Transition in Production of Communications Equipment
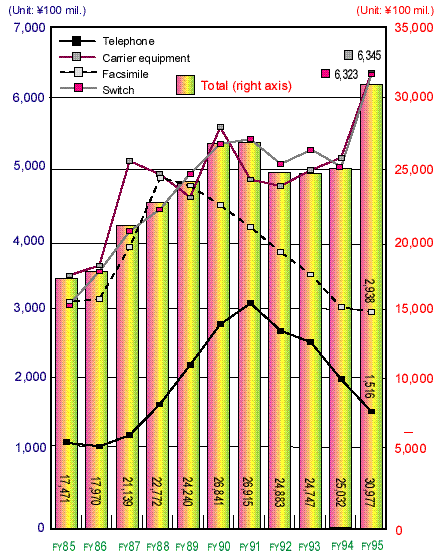
| Note: |
Data are based on the Statistics of Actual Production by the Ministry of Trade and Industry (MITI).
|
- Transition in Shipment of Cables
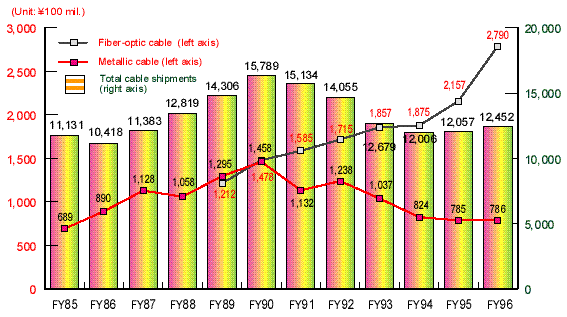
| Notes: |
*1: |
Data are based on the annual statistics of electric wire and cables by Japanese Electric Wire and Cable Makers Associat
ion, etc.
|
| *2: |
Figures on fiber-optic cable shipments include other opticaldevices.
|
| *3: |
Figures on communications cable are based on actual copper cable shipments in the telecommunications field.
|
- Transition in Personal Computer Shipments
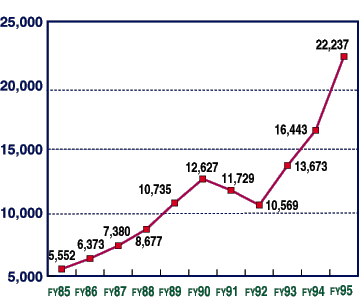
- Note:
- Data are based on the material from JEIDA (Japan Electronic Industry Development Association).
| Reference 7. |
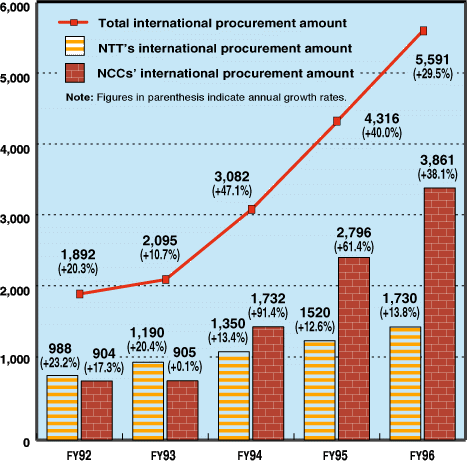
International Procurement Amounts of Type I Telecommunications Carriers |
(Unit: 100 million yen)
| Reference 8. |
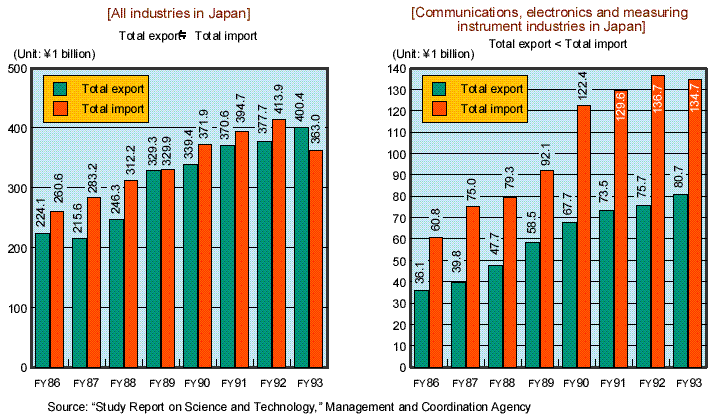
Trends in Technology Trade |
| Reference 9. |
Current Status of Broadcasting Business in Japan |
- Operating Status of Broadcasters
| |
FY91 |
FY92 |
FY93 |
FY94 |
FY95 |
FY96 |
FY97 |
5.98 |
| AM broadcasters |
48 |
48 |
48 |
48 |
48 |
48 |
48 |
48 |
| Shortwave broadcasters |
2 |
2 |
2 |
2 |
2 |
2 |
2 |
2 |
| FM broadcasters |
41 |
42 |
46 |
46 |
49 |
51 |
51 |
51 |
| Community broadcasters |
|
1 |
6 |
16 |
30 |
68 |
93 |
103 |
| FM sound multiplex broadcasters |
1 |
1 |
1 |
1 |
1 |
|
|
|
| FM teletext multiplex broadcasters |
|
|
|
|
34 |
40 |
40 |
40 |
FM teletext multiplex broadcasters
by community broadcasters
|
|
|
|
|
|
|
|
1 |
| TV broadcasters |
117 |
119 |
122 |
123 |
125 |
128 |
128 |
128 |
| TV sound multiplex broadcasters |
110 |
113 |
116 |
119 |
122 |
126 |
68 |
58 |
| TV teletext multiplex broadcasters |
25 |
25 |
25 |
25 |
24 |
25 |
26 |
26 |
| TV data multiplex broadcasters |
|
|
|
|
|
2 |
13 |
14 |
TV teletext multiplex and
TV data multiplex broadcasters
|
|
|
|
|
|
|
16 |
16 |
| BS TV broadcasters |
2 |
2 |
2 |
2 |
2 |
2 |
2 |
2 |
| BS sound multiplex broadcasters |
3 |
3 |
3 |
3 |
3 |
3 |
2 |
2 |
| BS data multiplex broadcasters |
|
|
|
1 |
1 |
1 |
1 |
1 |
| CS digital TV broadcasters |
|
|
|
|
|
1 (56) |
2 (71) |
3 (115) |
| CS digital sound broadcasters |
|
|
|
|
|
1 (6) |
2 (8) |
3 (8) |
| CS digital data broadcasters |
|
|
|
|
|
1 (1) |
2 (2) |
3 (4) |
| CS analog TV broadcasters |
|
2 (6) |
2 (9) |
2 (10) |
2 (13) |
2 (13) |
2 (13) |
2 (8) |
| CS analog sound multiplex broadcasters |
|
2 (6) |
2 (9) |
2 (10) |
2 (13) |
2 (13) |
2 (13) |
2 (8) |
| CS analog teletext multiplex broadcasters |
|
|
|
|
1 (2) |
1 (2) |
1 (2) |
1 (2) |
| CS-PCM sound multiplex broadcasters |
|
2 (6) |
1 (4) |
1 (3) |
1 (2) |
1 (1) |
1 (1) |
1 (1) |
| CS analog data multiplex broadcasters |
|
|
|
|
1 (1) |
1 (1) |
1 (1) |
1 (1) |
| Notes: |
1. |
Numbers of broadcasters include NHK, the University of the Air
and other broadcasters.
|
| 2. |
Figures in parenthesis are the numbers of program supplying
broadcasters who entrust broadcasting to facility supplying broadcasters
(broadcast station licensees).
|
- Diffusion of Terrestrial Broadcasting
| |
Commercial broadcasters | NHK |
| TV Broadcasting |
Four to six broadcast channels are viewable in 90% of total household. |
One general and one education channel are broadcast nationwide. |
| AM Broadcasting |
Available nationwide. In major areas,two or three channels are broadcast. |
One general and one education channel are broadcast nationwide. |
| FM Broadcasting |
Available nationwide. In major areas two channels are broadcast. In addition,community broadcasting is conducted. |
One channel is broadcast nationwide. |
| Short Wave |
One channel is broadcast nationwide. |
(Overseas broadcasting is Broadcasting conducted.) |
| Note: |
In addition to the above, the University of the Air Foundation
broadcasts one TV and one FM channel, targeting a major part of the
Kanto Region as its coverage area.
|
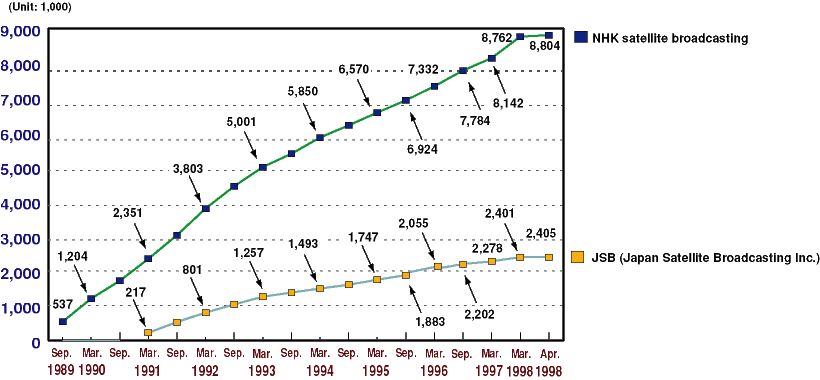
- Current Status of DBS in Japan
- a)
- DBS via broadcasting satellite
- b)
- DBS via communications satellites
i. Transition of receiver's contract
(Unit: 1,000 households)
| |
Mar. 1993 |
Mar. 1994 |
Mar. 1995 |
Mar. 1996 |
Mar. 1997 |
Apr. 1998 |
CS TV
broadcasting
|
Analog |
44 |
127 |
275 |
516 |
626 |
279 |
| Digital |
- |
- |
- |
- |
236 |
672 |
| CS-PCM |
- |
12 |
25 |
38 |
45 |
128 |
ii. Numbers of licensees and channels by type
Digital broadcasting
| |
Type of broadcasting |
No. of licensees |
No. of channels |
JSAT
(JCSAT-3) |
Standard TV broadcasting
Sound broadcasting
Data broadcasting
|
61
7*1
1*2
|
103
107
26
|
JSAT
(JCSAT-4)
|
Standard TV broadcasting
Sound broadcasting
Data broadcasting
|
58
1
2
|
68
29
17
|
| SCC (SUPERBIRD-C) |
Standard TV broadcasting
Sound broadcasting
Data broadcasting
|
18
1
1
|
90
29
16
|
| Notes: |
*1. |
Four of 7 sound broadcasters operate standard TV broadcasting service. |
| *2. |
The data broadcaster operates standard broadcasting service. |
Analog broadcasting
| Satellite |
Type of broadcasting |
No. of licensees |
No. of channels |
JSAT
(JCSAT-2)
|
PCM sound broadcasting
Data broadcasting
|
1
1
|
17
1
|
| SCC (SUPERBIRD-B) |
Standard TV broadcasting |
8 |
9 |
Return


