Contents
Establishment Section
Postal Service
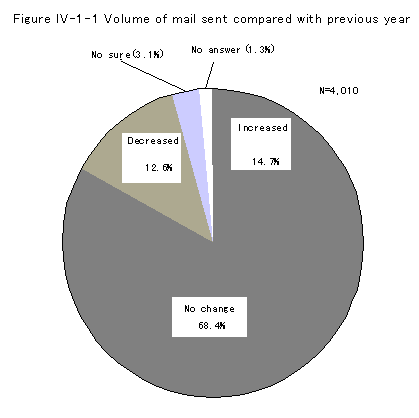
- Volume of mail sent compared with previous year
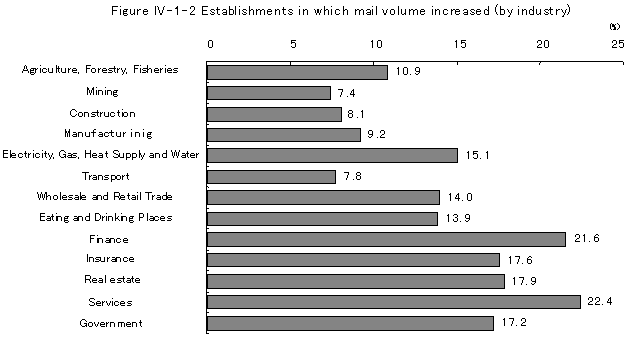
The ratio of change in the volume of mail sent out was "increased" (14.7%), "No change" (68.4%), "decreased" (12.6%), and "not sure" (3.1%). Looking at the "increased" category by industry shows that increases occurred in the Service (22.4%) and Finance (21.6%).
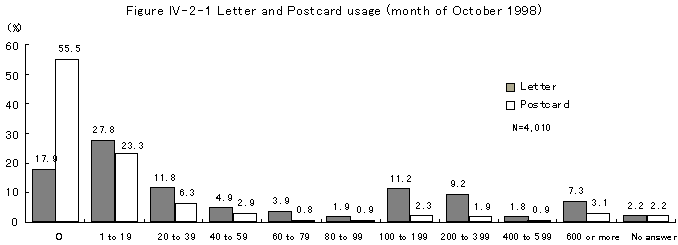
- Domestic postal services and Private courier usage (month of October 1998)
The ratio of establishments using domestic postal services and private courier in the month of October 1998 was letters 79.9%, postcards 42.3%, parcel post 11.5%, and private courier 31.5%. Tabulated by "number sent," we see that letters and postcards were both highest in the 1 to 19 pieces category, parcel post was highest in the 2 to 3 pieces category, and private courier was highest in the 10 to 29 pieces category.

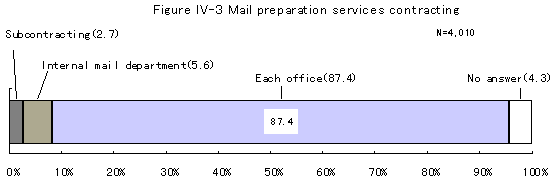
- Mail preparation services contracting
A survey on mail preparation services contracting showed that the ratio of establishments answering "subcontracting this work" was 2.7%, while the number of establishments answering "internal mail department" was 5.6%, and the number answering "being done by each office" was 87.4%.
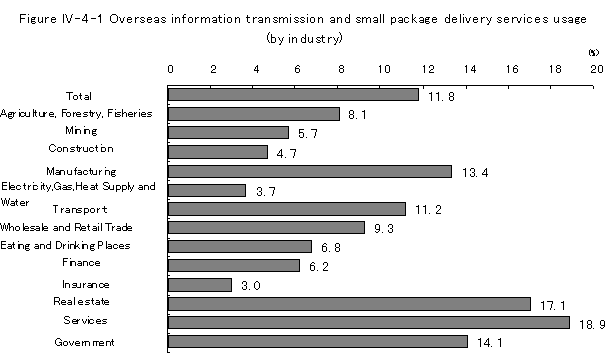
- Overseas information transmission and small package delivery services usage
The ratio of establishments sending small packages and information overseas was 11.8%. Looking at this usage by industry, we see that ratios were high in the Services (18.9%) and Real estate (17.1%).
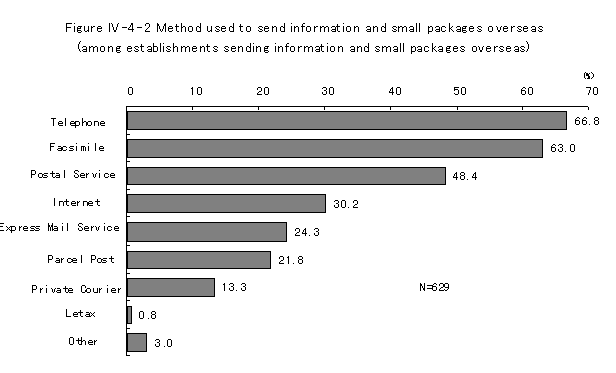
Tabulated by "method selected to transmit information or send small packages overseas," the method with the highest percentage was "telephone" (66.8%), followed by "fax" (63.0%), and "postal service" (48.4%).
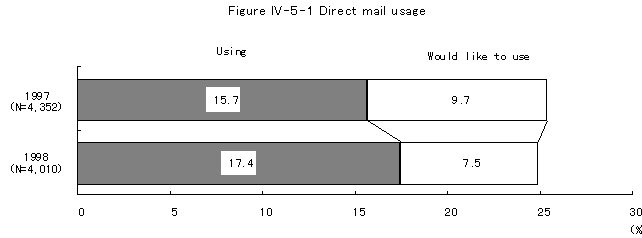
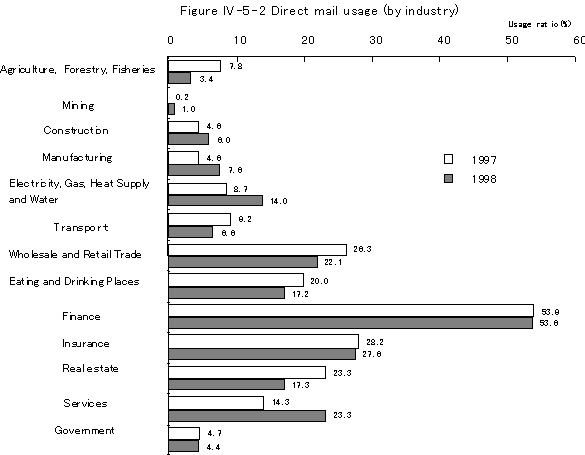
- Direct mail usage
The ratio of establishments using Direct mail was 17.4%, increased slightly by 1.7 percentage-points over the previous survey. Additionally, the ratio of establishments that are considering using Direct mail in the future was 7.5%.
Tabulated by industry, Direct mail usage was highest in Finance at 53.6%, followed by Insurance (27.6%), and Services (23.3%).
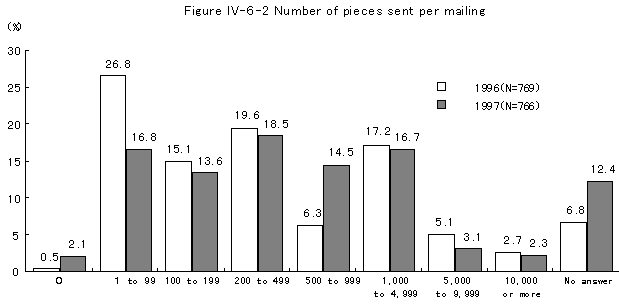
- Frequency and number of pieces sent annually by Directly mail
The ratio for "number of Direct-mail mailings" in fiscal 1997 was highest in the "1-4" category (43.8%), followed by "10-19" (19.2%) and "20-49" (10.2%).
The "number of pieces sent per mailing" was highest in the category "200-499" (18.5%), followed by "1-99" (16.8%), and "1,000-4,000" (16.7%).

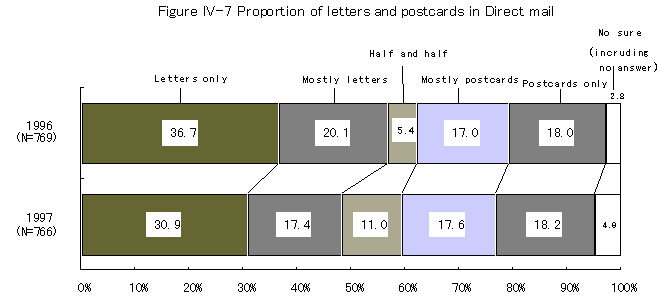
- Proportion of letters and postcards in Direct mail
The ratio of "letters and postcards in Direct mail" in fiscal 1997 was highest in the category "letters only" at 30.9%. However, that represented a 5.8 percentage-point decrease since the previous survey.
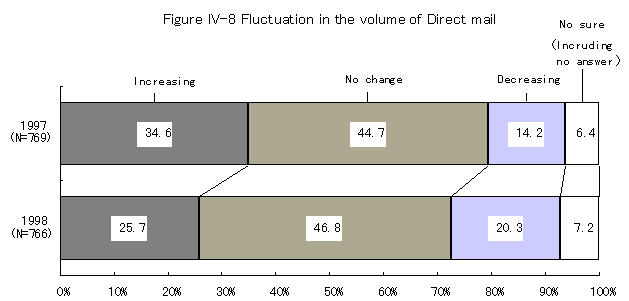
- Fluctuation in the volume of Direct mail
Comparing the number of pieces planned to be sent in fiscal 1998 and the number of pieces planned to be sent in fiscal 1997, the "increasing" category was 25.7%, 8.9 percentage-points lower than the previous survey. "No change" (46.8%) (a 2.1 percentage-point decrease) and "decreasing" (20.3%) (a 6.1 percentage-point increase) were higher than the previous survey.