2023 WHITE PAPER
Data Collection
Chapter 1 - Section 1
Chapter 1 - Section 2
Chapter 2 - Section 1
Chapter 2 - Section 2
Chapter 2 - Section 3
Chapter 3 - Section 1
Chapter 3 - Section 2
Column
Chapter 4 - Section 1
Chapter 4 - Section 2
Chapter 4 - Section 3
Chapter 4 - Section 4
Chapter 4 - Section 5
Chapter 4 - Section 6
Chapter 4 - Section 7
Chapter 4 - Section 8
Chapter 4 - Section 9
Chapter 4 - Section 10
Chapter 4 - Section 11
Chapter 4 - Section 12
Policy Focus 1
Chapter 5 - Section 2
Chapter 5 - Section 3
Chapter 5 - Section 4
Chapter 5 - Section 5
Chapter 5 - Section 7
Policy Focus 2
Chapter 5 - Section 8
Policy Focus 3
Chapter 5 - Section 9
Chapter 1 - Section 1
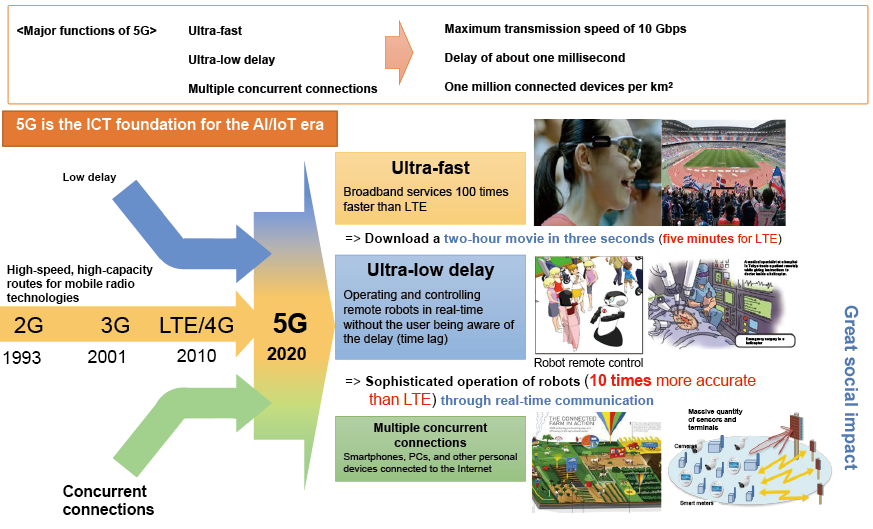
- Evolution of mobile communications systems | (Figure 1-1-2-1 in White Paper)
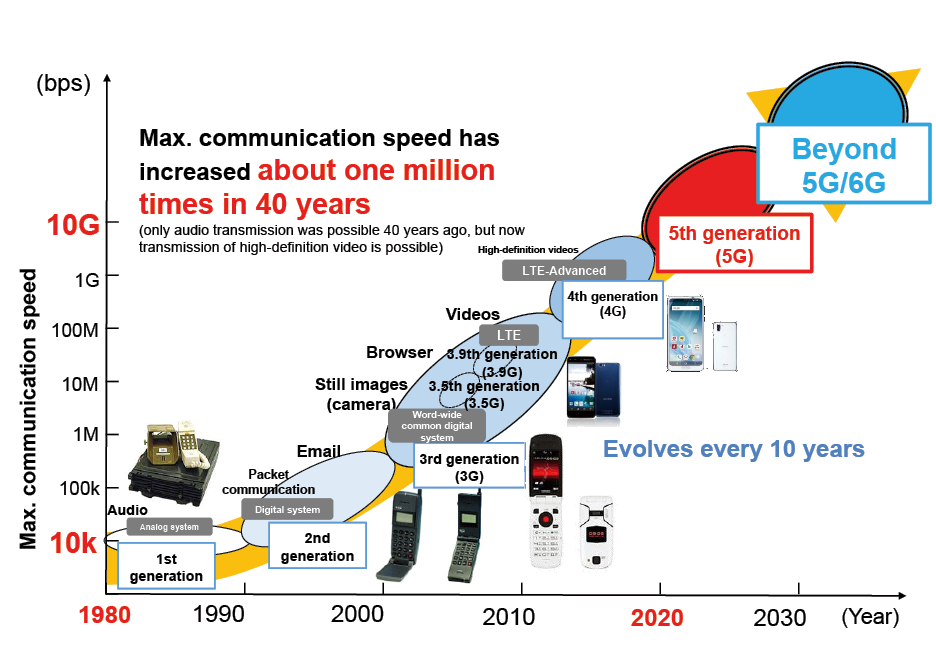
(Source) Material created by MIC
Chapter 1 - Section 2
- Changes from Web 1.0 to Web 2.0 | (Figure 1-2-2-1 in White Paper)
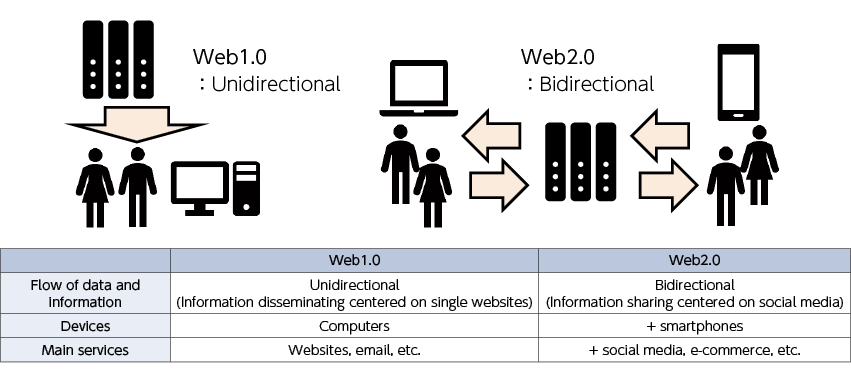
(Source) Based on Document 1-2 from the first meeting of the MIC Study Group on the Utilization of Metaverse Toward Web 3 Era
Chapter 2 - Section 1
- Predicted global mobile data traffic by device | (Figure 2-1-1-1 in White Paper)
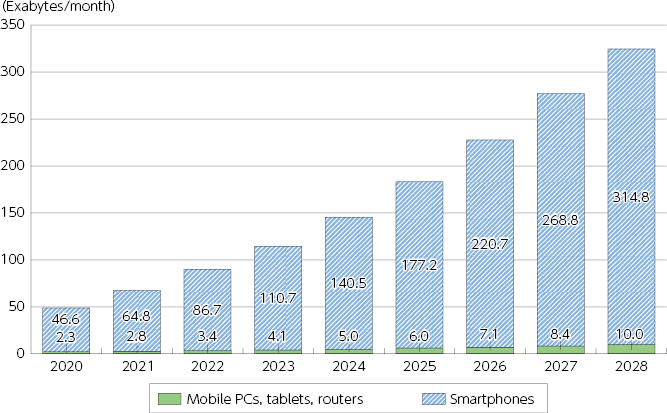
(Source) Prepared based on “Ericsson Mobility Visualizer by Ericsson”
- Global mobile data traffic forecast (5G and Non-5G)
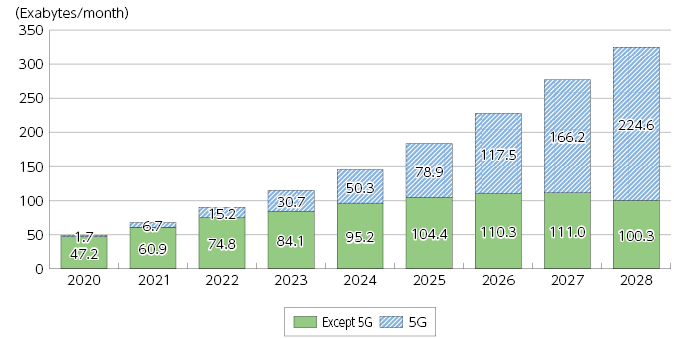
(Source) Prepared based on “Ericsson Mobility Visualizer by Ericsson”
- Cross-border Internet bandwidth by top countries and regions | (Figure 2-1-1-2 in White Paper)
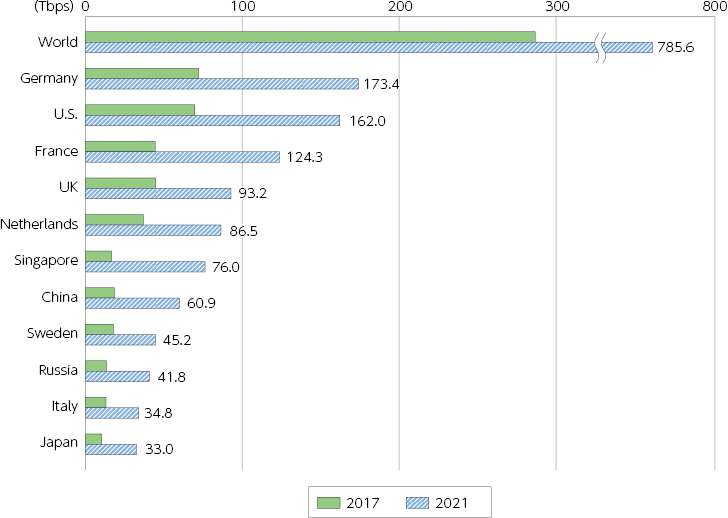
*The classification of regions is based on TeleGeography's definition, and the regional totals are the sums of the countries for which data is available.
(Source) Japan External Trade Organization (JETRO) (Aug. 2, 2022) “The data environment is now (worldwide) - A look at cross-border data flows, investment and trade rules”
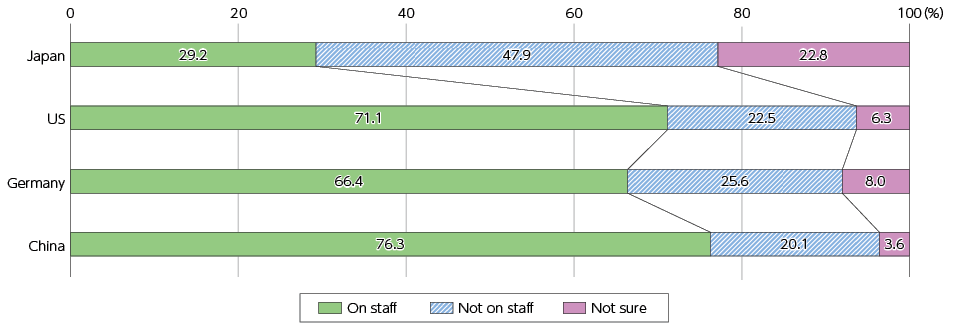
- Utilization of personal data by companies in each country | (Figure 2-1-2-1 in White Paper)
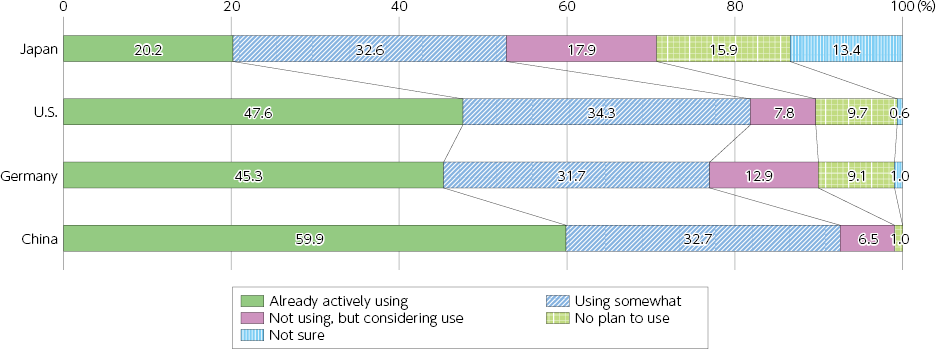
(Source) MIC (2023) “Survey Research on R&D on the Latest Information and Communications Technologies and Trends of Use of Digital Technologies in Japan and Abroad”
- Utilization of data other than personal data
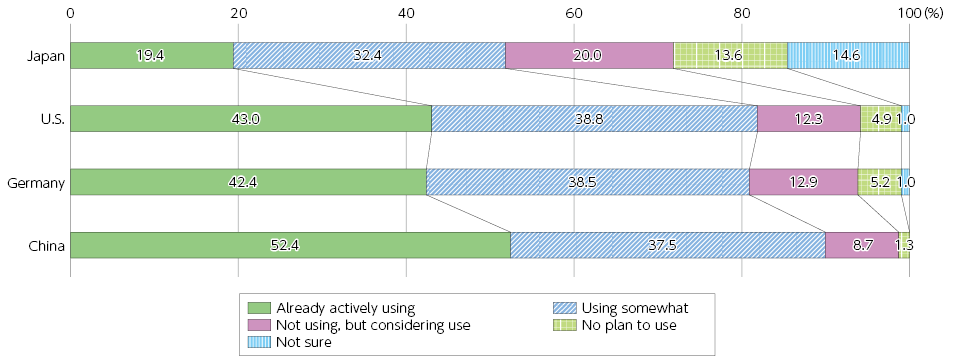
(Source) MIC (2023) “Survey Research on R&D on the Latest Information and Communications Technologies and Trends of Use of Digital Technologies in Japan and Abroad”
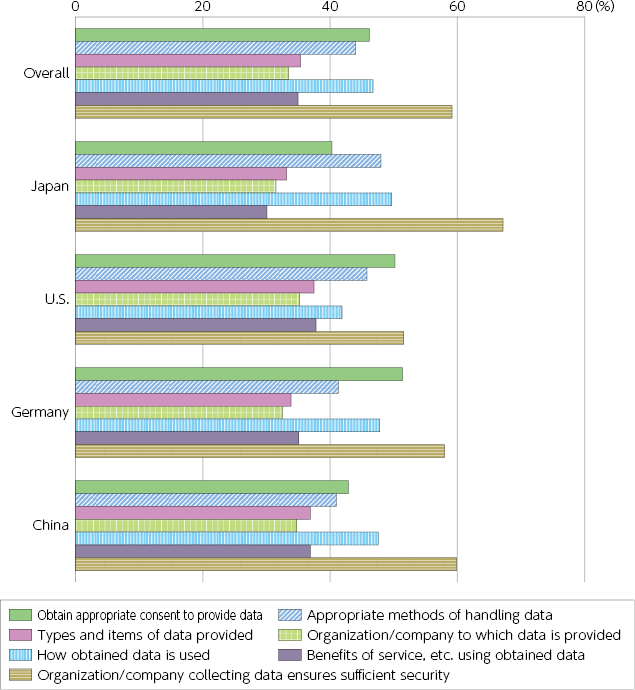
- Issues and barriers envisaged in the handling and use of personal data | (Figure 2-1-2-2 in White Paper)
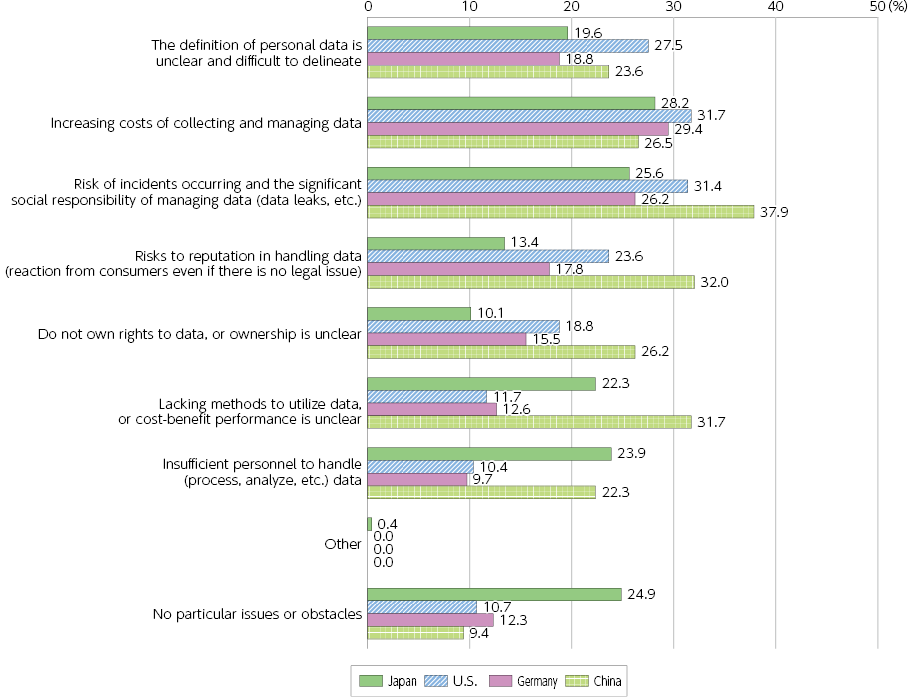
(Source) MIC (2023) “Survey Research on R&D on the Latest Information and Communications Technologies and Trends of Use of Digital Technologies in Japan and Abroad”
- Intent regarding using services that require the provision of personal data | (Figure 2-1-2-3 in White Paper)
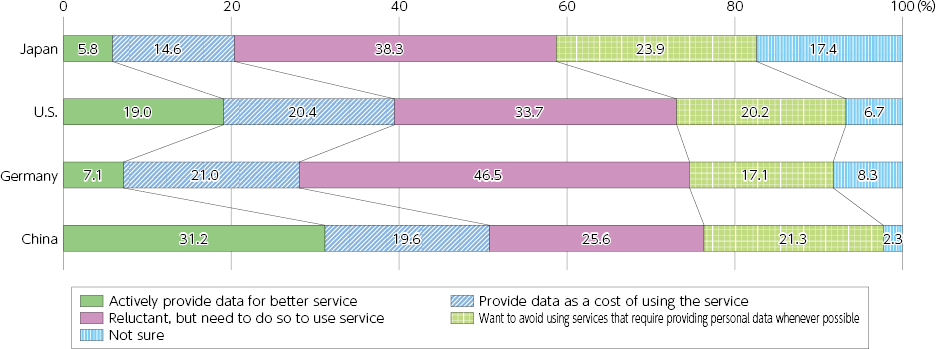
(Source) MIC (2023) “Survey Research on R&D on the Latest Information and Communications Technologies and Trends of Use of Digital Technologies in Japan and Abroad”
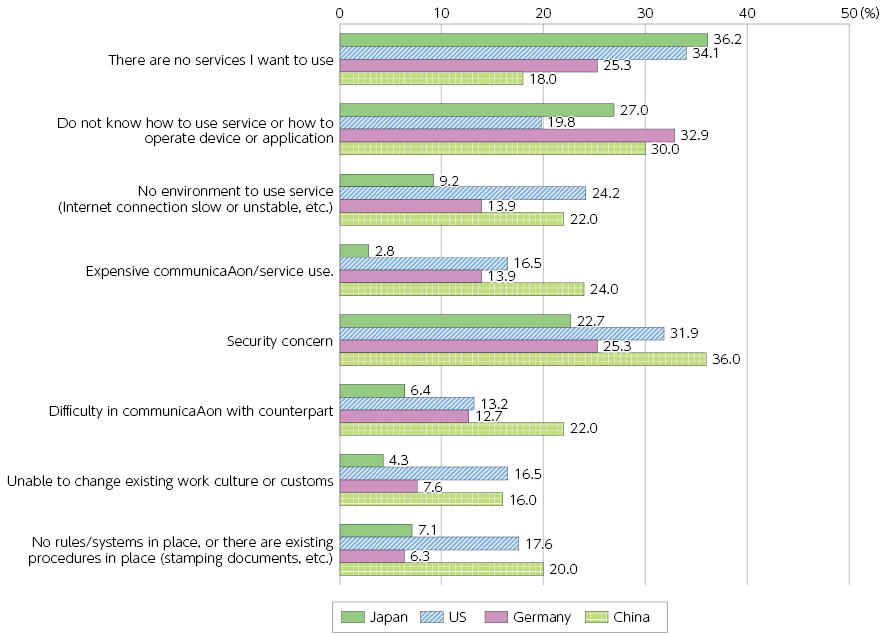
- Reasons for reluctance to provide personal data when using services | (Figure 2-1-2-4 in White Paper)
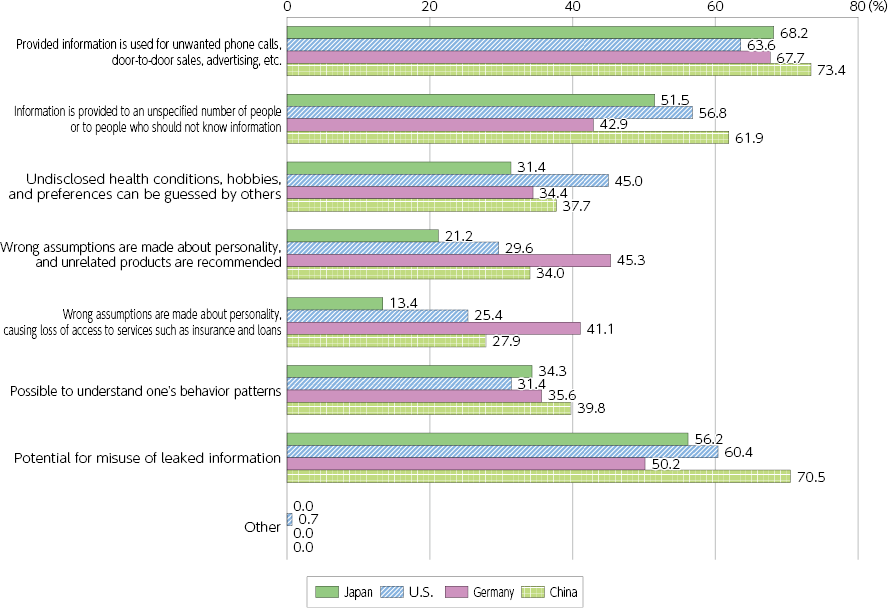
(Source) MIC (2023) “Survey Research on R&D on the Latest Information and Communications Technologies and Trends of Use of Digital Technologies in Japan and Abroad”
- Conditions for providing personal data to companies
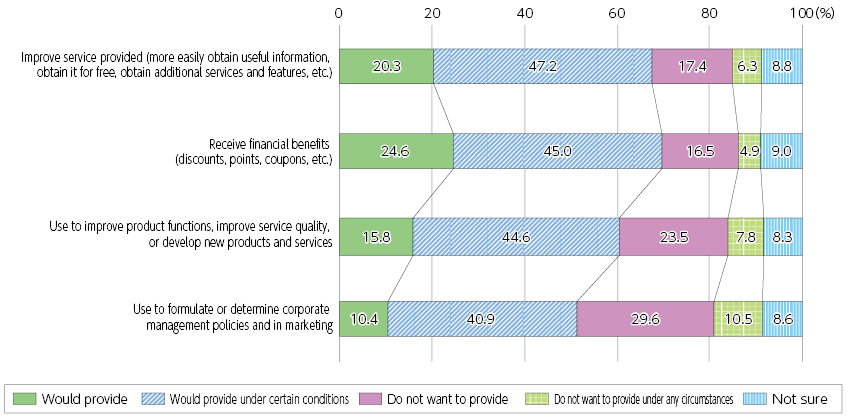
(Source) MIC (2023) “Survey Research on R&D on the Latest Information and Communications Technologies and Trends of Use of Digital Technologies in Japan and Abroad”
Chapter 2 - Section 2
- Mobile Internet traffic by application (first half of 2022) | (Figure 2-2-1-1 in White Paper)
(Source) Prepared based on “PHENOMENA (THE GLOBAL INTERNET PHENOMENA REPORT JANUARY 2023)” by SANDVINE.
- Platforms with the most monthly unique users in the U.S. (July 2022)
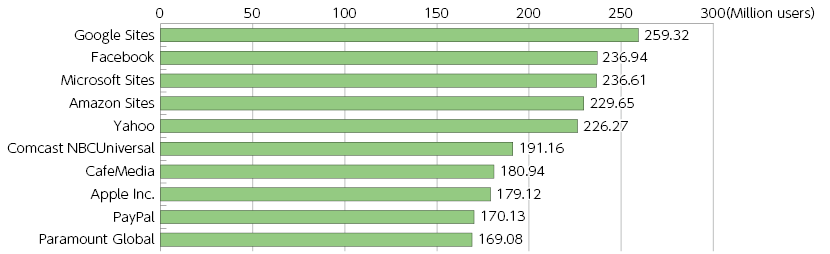
(Source) Statista “Most popular multi-platform web properties in the United States in July 2022, based on number of unique visitors”
- Example of data items collected by platform providers | (Figure 2-2-1-2 in White Paper)
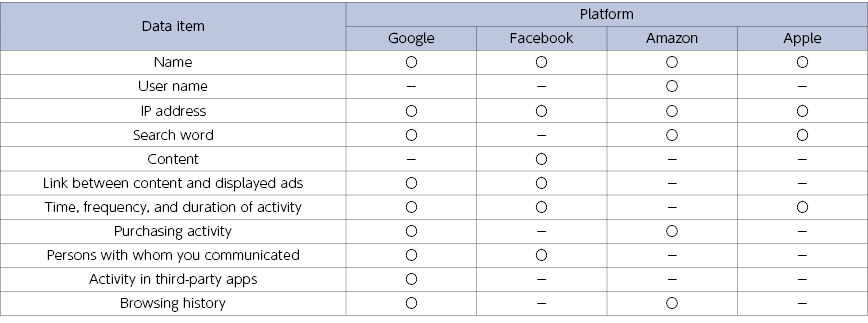
(Source) Prepared using an extract from “The Data Big Tech Companies Have On You” by Security.org
- Sales trends of major platform providers | (Figure 2-2-2-1 in White Paper)
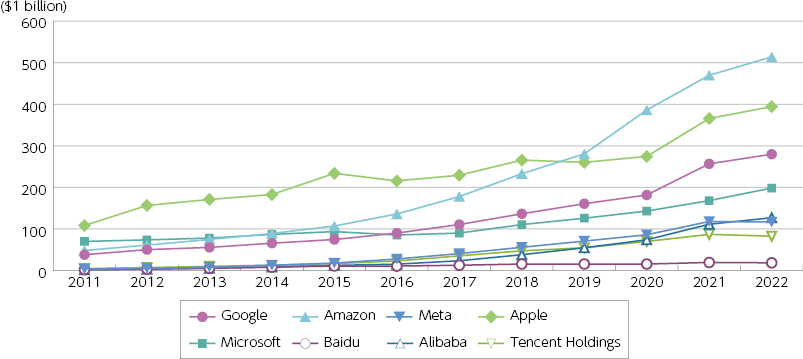
(Source) MIC (2023) “Survey Research on ICT Market Trends in Japan and Abroad”
- Advertising spending as a percentage of platform provider sales (2022) | (Figure 2-2-3-1 in White Paper)
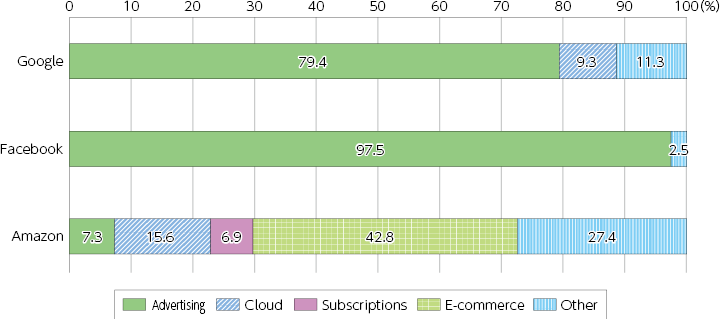
(Source) Prepared based on the published data of each company
- Cases of investigation and prosecution of platform providers | (Figure 2-2-3-2 in White Paper)
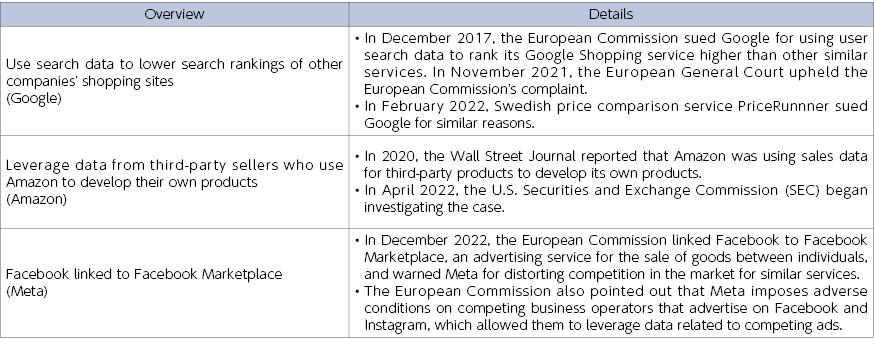
(Source) MIC (2023) “Survey Research on the Advancement of ICT Infrastructure and Distribution of Digital Data and Information”
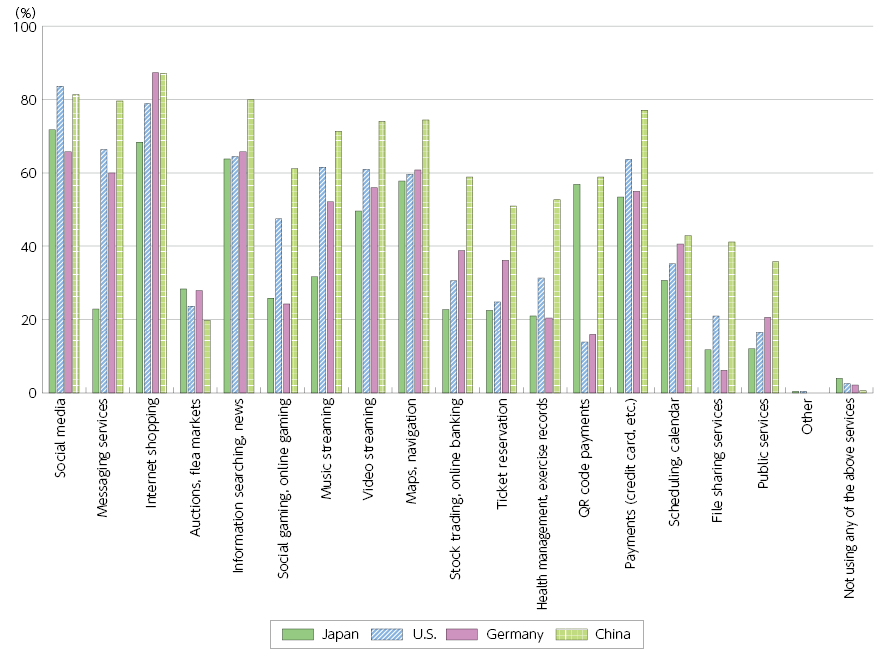
- Services that individuals have used (multiple responses)
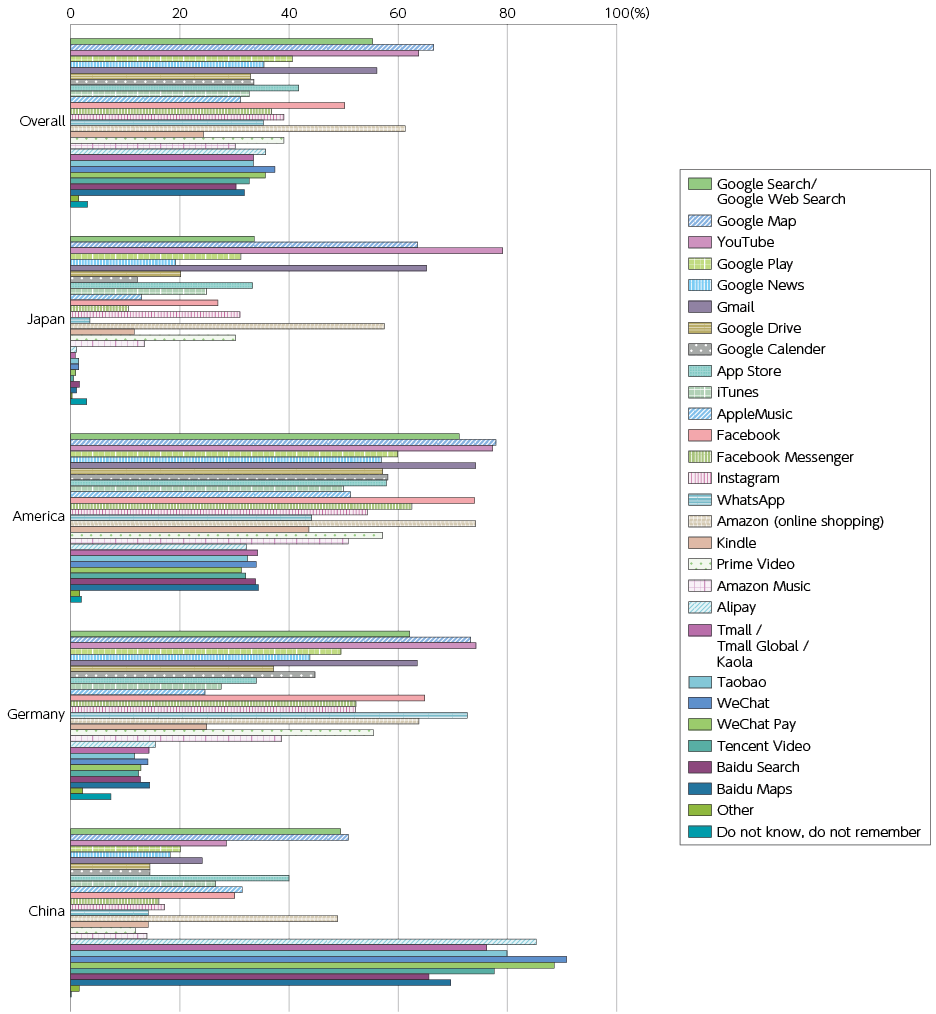
(Source) MIC (2023) “Survey Research on the Advancement of ICT Infrastructure and Distribution of Digital Data and Information”
- Awareness regarding the provision of personal data | (Figure 2-2-3-3 in White Paper)
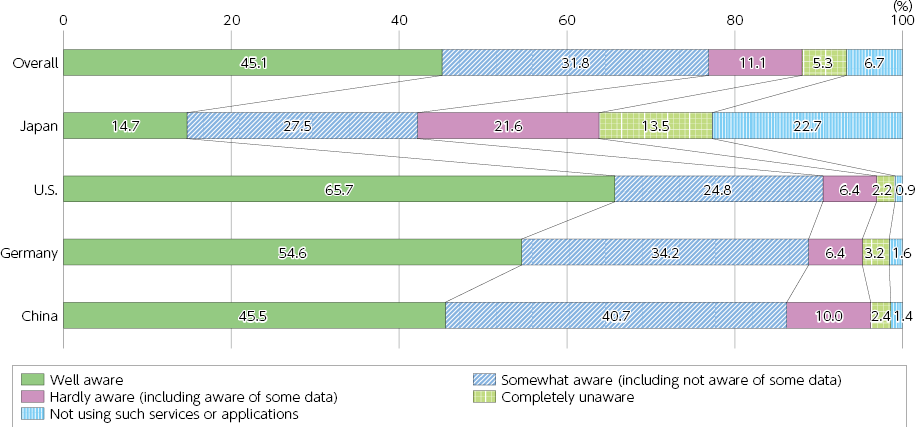
(Source) MIC (2023) “Survey Research on the Advancement of ICT Infrastructure and Distribution of Digital Data and Information”
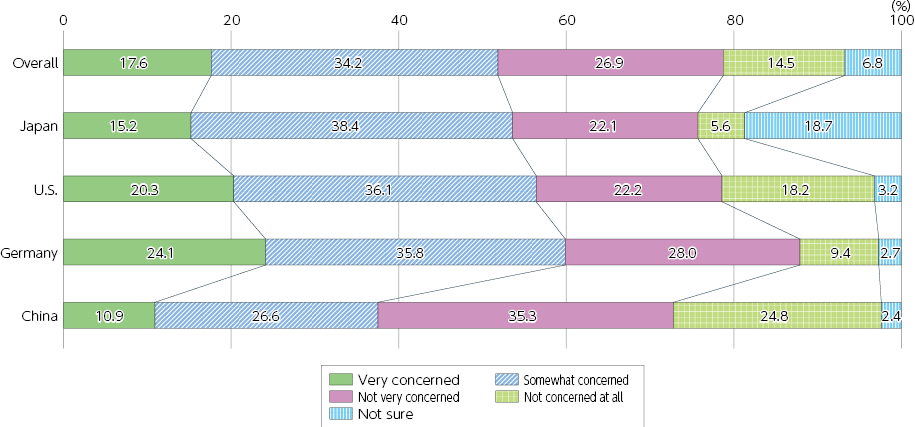
- Concerns over the provision of personal data | (Figure 2-2-3-4 in White Paper)
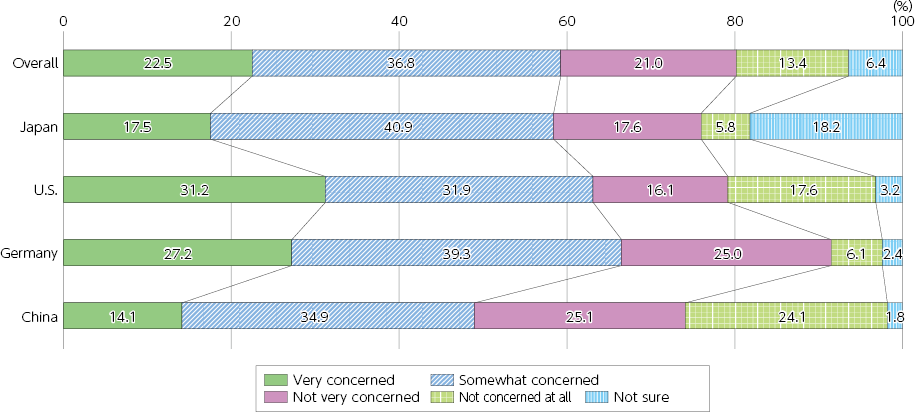
(Source) MIC (2023) “Survey Research on the Advancement of ICT Infrastructure and Distribution of Digital Data and Information”
- Points to consider when providing personal data | (Figure 2-2-3-5 in White Paper)
(Source) MIC (2023) “Survey Research on the Advancement of ICT Infrastructure and Distribution of Digital Data and Information”
- Concerns over the display of personalized search results and advertisements, etc. | (Figure 2-2-3-6 in White Paper)
(Source) MIC (2023) “Survey Research on the Advancement of ICT Infrastructure and Distribution of Digital Data and Information”
- Impact of the display of personalized advertising on usage | (Figure 2-2-3-7 in White Paper)
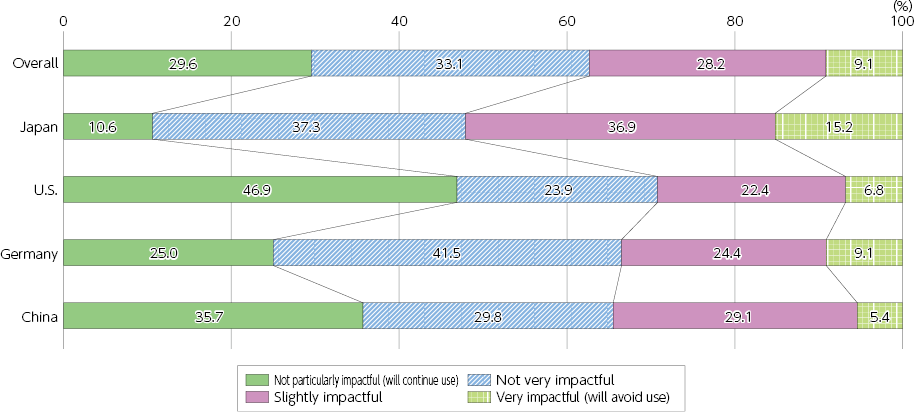
(Source) MIC (2023) “Survey Research on the Advancement of ICT Infrastructure and Distribution of Digital Data and Information”
Chapter 2 - Section 3
- Questionnaire survey of social media users (personal experience) | (Figure 2-3-1-1 in White Paper)
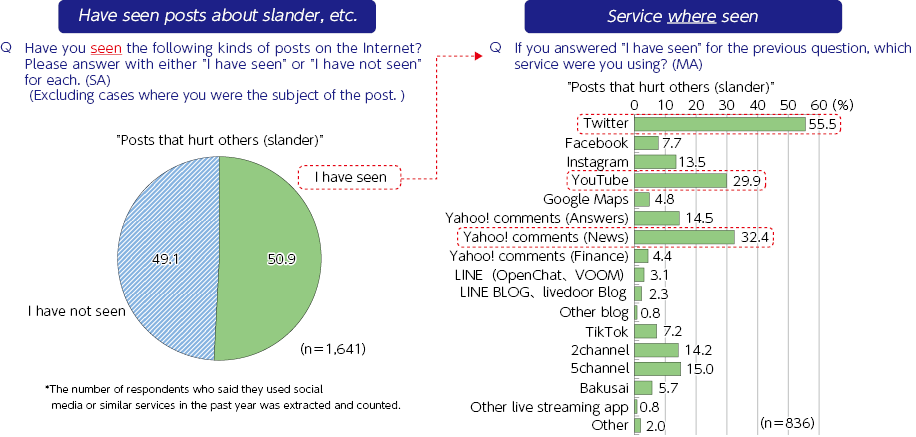
(Source) MIC Platform Service Study Group (40th meeting) - Material 2
- Media services in which disinformation was seen
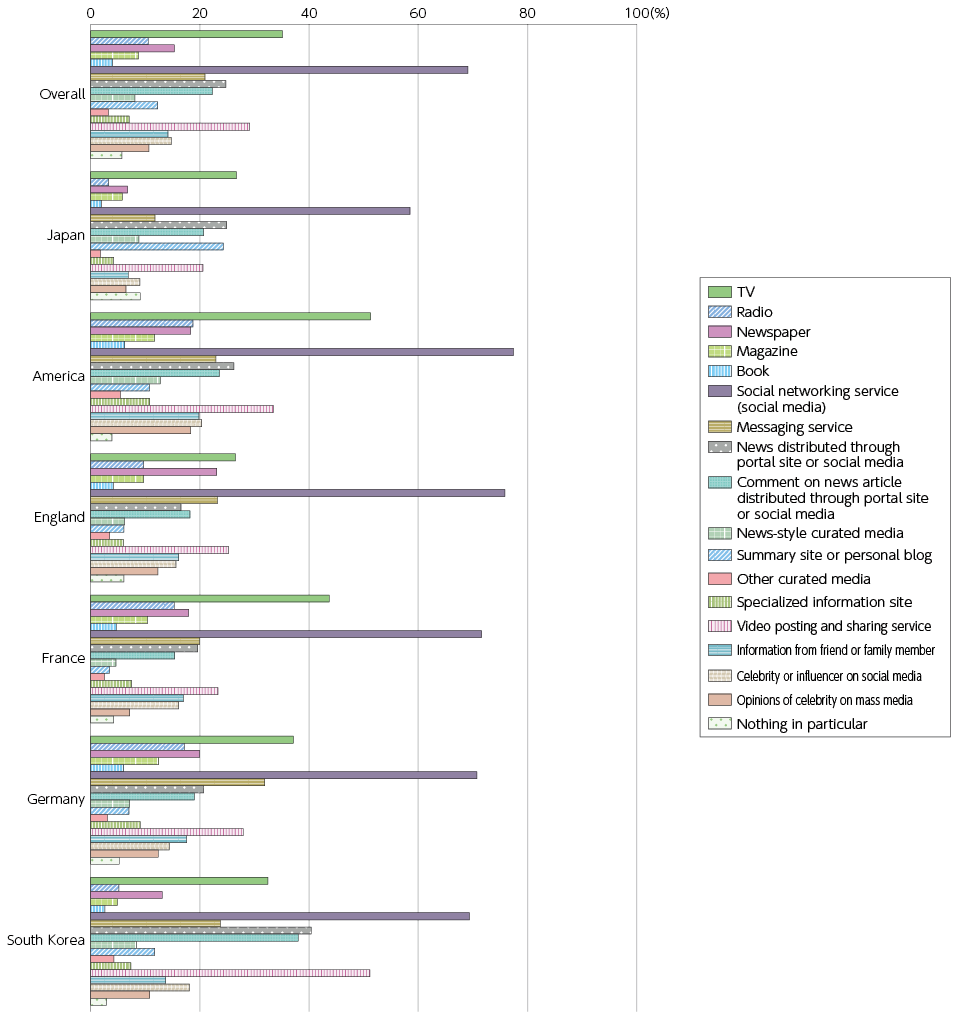
(Source) MIC “Fiscal 2021 Survey on Awareness of Disinformation in Japan and Other Countries”
- Recent deepfake cases | (Figure 2-3-1-2 in White Paper)
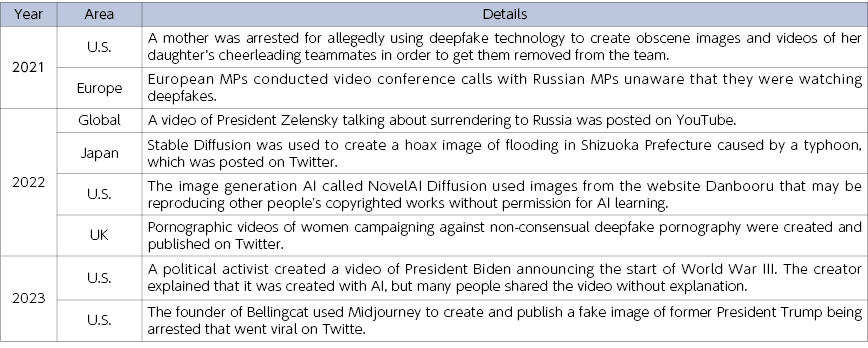
(Source) Prepared based on various websites
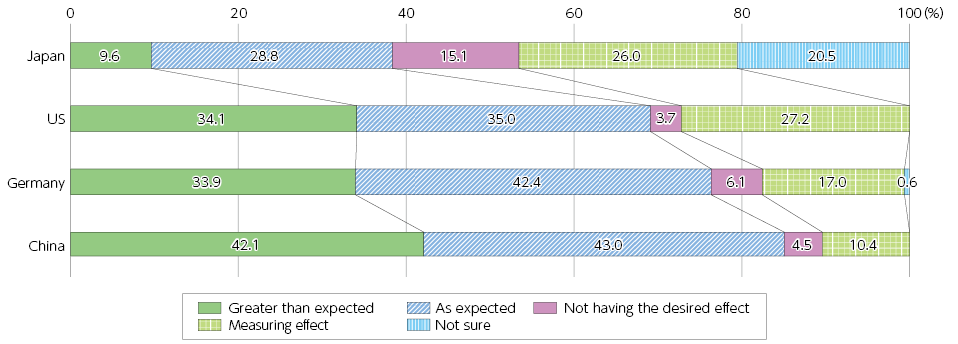
- What to do when you want the latest news online (Japan, U.S., Germany and China) | (Figure 2-3-2-1 in White Paper)
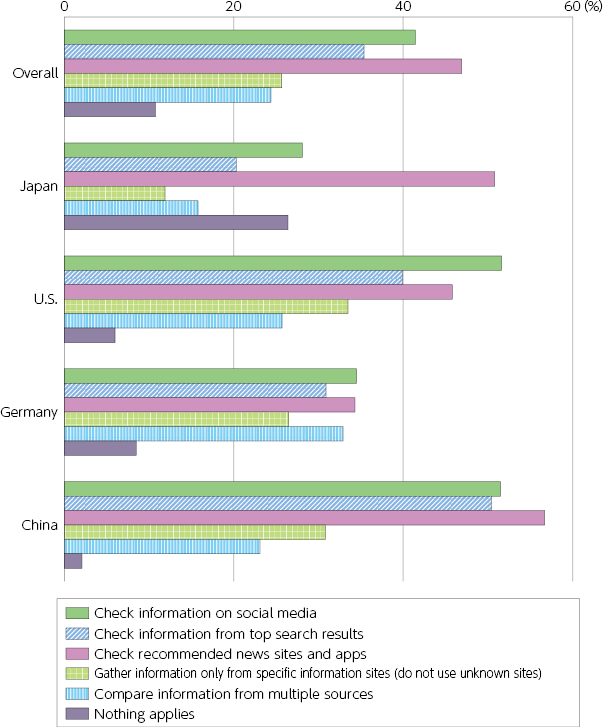
(Source) MIC (2023) “Survey Research on the Advancement of ICT Infrastructure and Distribution of Digital Data and Information”
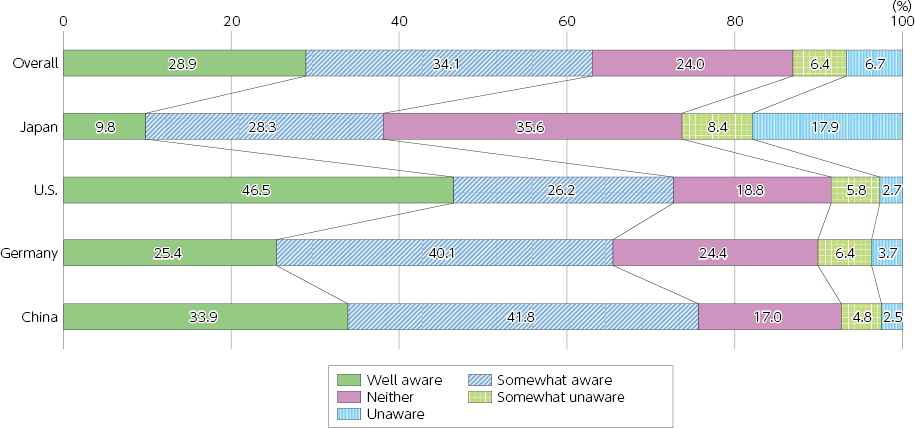
- Awareness of whether or not the information displayed in search results, social media, etc. is personalized | (Figure 2-3-2-2 in White Paper)
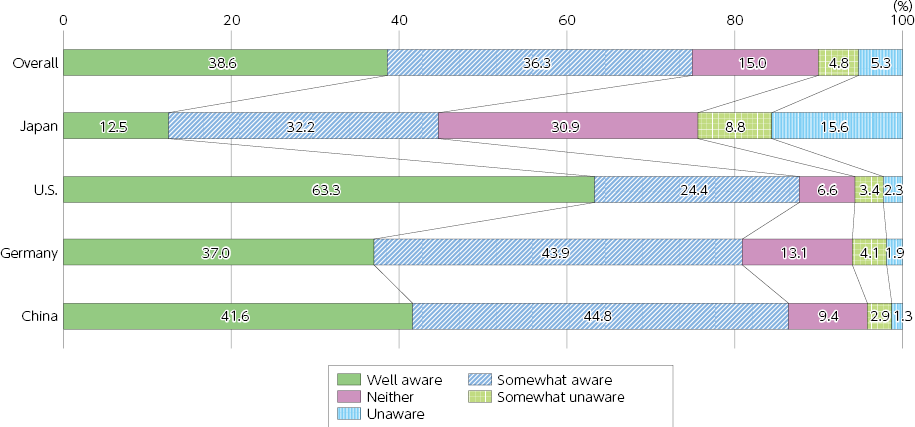
(Source) MIC (2023) “Survey Research on the Advancement of ICT Infrastructure and Distribution of Digital Data and Information”
- Awareness of whether or not the service provider is presenting you with accounts or content they want you to see | (Figure 2-3-2-3 in White Paper)
(Source) MIC (2023) “Survey Research on the Advancement of ICT Infrastructure and Distribution of Digital Data and Information”
- Awareness of the tendency for opinions and information close to your own views to be displayed in social media, etc. | (Figure 2-3-2-4 in White Paper)
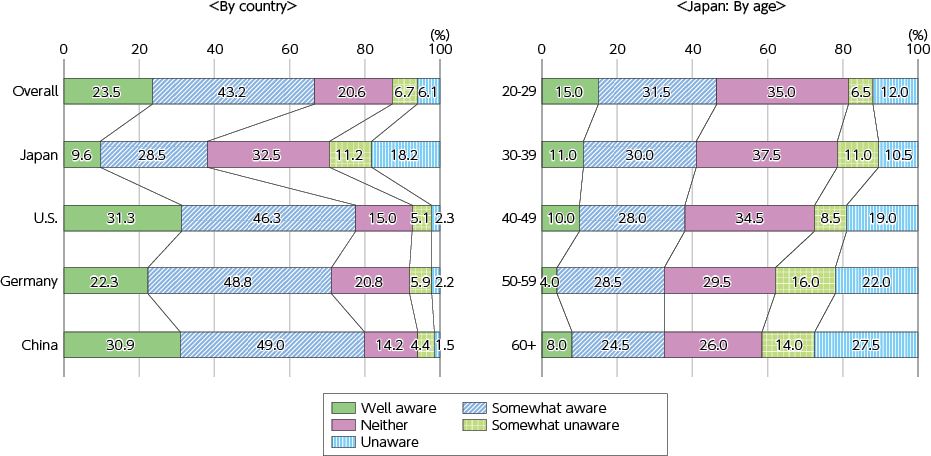
(Source) MIC (2023) “Survey Research on the Advancement of ICT Infrastructure and Distribution of Digital Data and Information”
- Regression analysis of media literacy and information literacy and the behavior of judging and spreading disinformation and misinformation | (Figure 2-3-3-1 in White Paper)
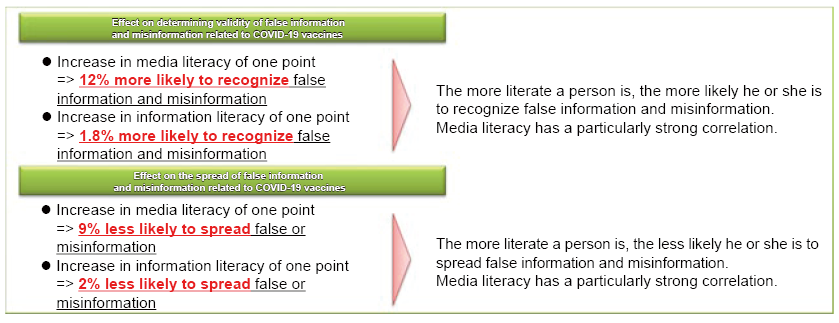
(Source) Innovation Nippon Report (April 2022) “Understanding the Reality of Disinformation and Misinformation in Japan and Examining Social Countermeasures ― Empirical Analysis of Disinformation and Misinformation Regarding Politics and Coronavirus Vaccines, etc.”
- Initiatives for improving digital literacy in Japan | (Figure 2-3-3-2 in White Paper)
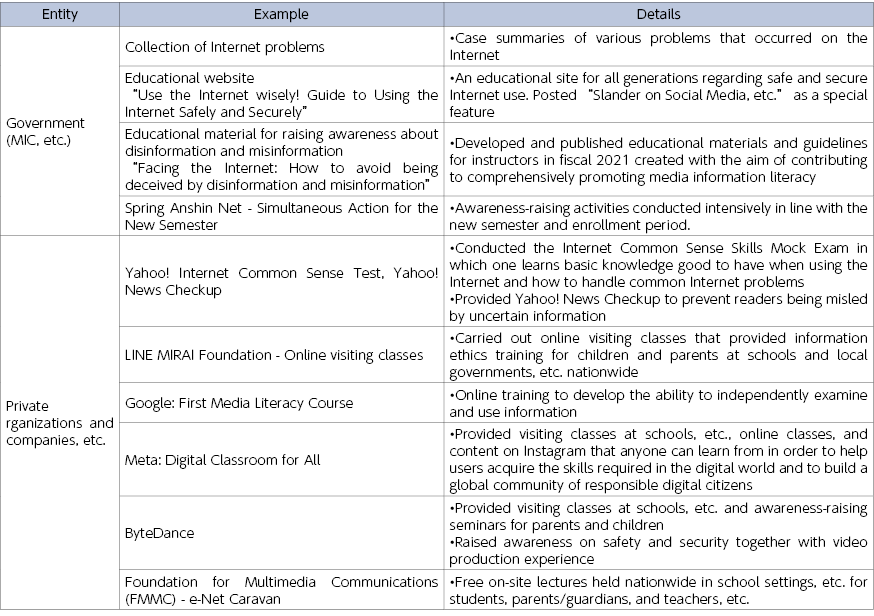
(Source) Prepared by MIC based on various published materials
- Precedents of media information literacy education in Europe and the U.S. | (Figure 2-3-3-3 in White Paper)
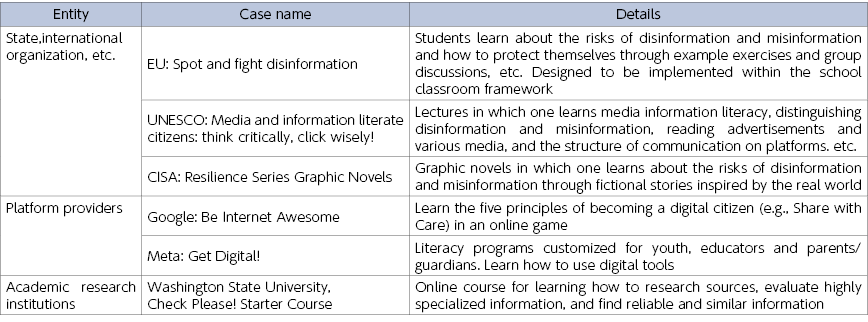
(Source) MIC (2022) “Report on the Survey on the Current Status and Issues of Measures for Improving Media Information Literacy”
- Level of awareness of fact-checking | (Figure 2-3-4-1 in White Paper)
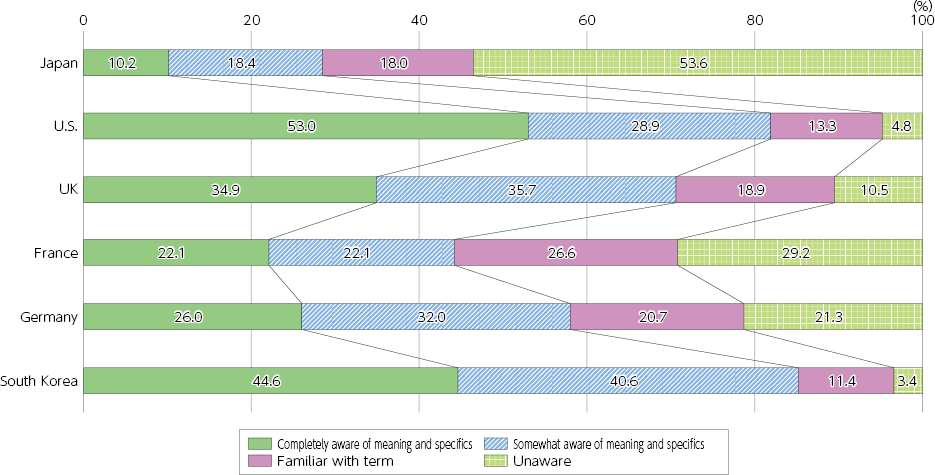
(Source) MIC “Fiscal 2021 Survey on Disinformation Awareness in Japan and Other Countries”
- Activities of fact-checking organizations, etc. in other countries | (Figure 2-3-4-2 in White Paper)
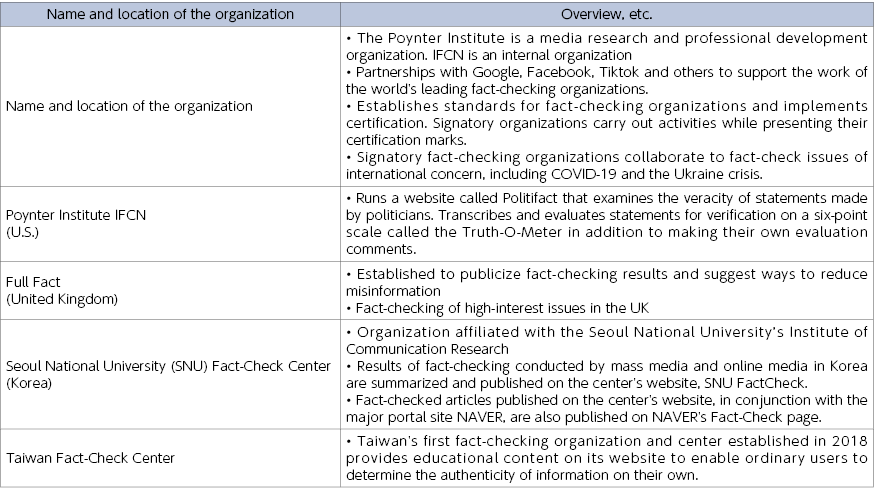
(Source) Prepared by MIC based on various published materials
- An example of a confidence score using Microsoft Video Authenticator | (Figure 2-3-5-1 in White Paper)

*The trustworthiness of the video is shown in real time. The red box indicates the deepfaked part.
(Source) Microsoft “New Steps to Combat Misinformation”
Chapter 3 - Section 1
- Features of Web3 | (Figure 3-1-1-1 in White Paper)
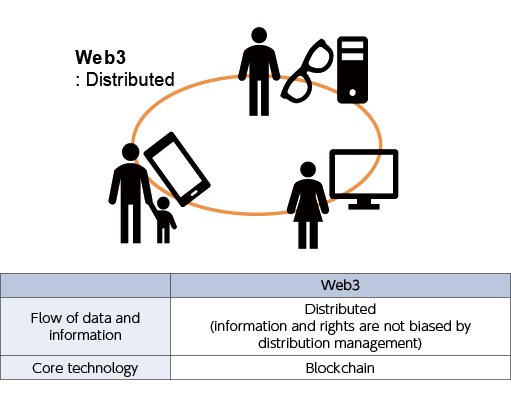
(Source) Based on Document 1-2 from the 1st meeting of the MIC Study Group on the Utilization of Metaverse Towards Web3 Era
- Awareness of metaverses by country | (Figure 3-1-2-1 in White Paper)
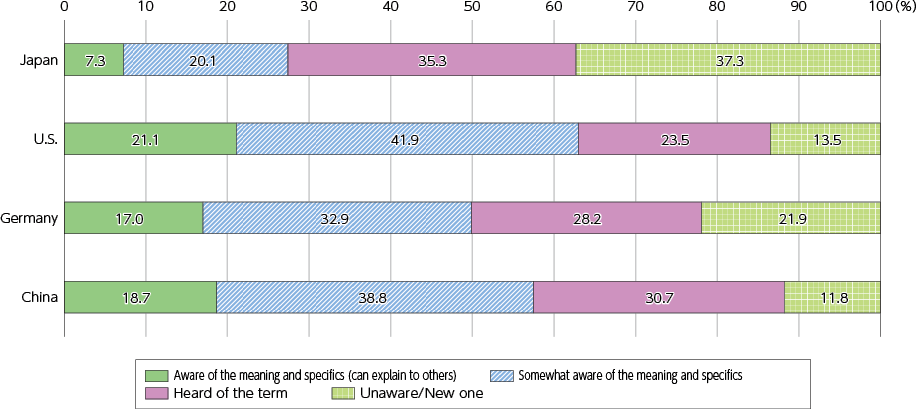
(Source) MIC (2023) “Survey Research on Advancement of ICT Infrastructure and Flow of Digital Data and Information”
- Awareness of metaverses by age
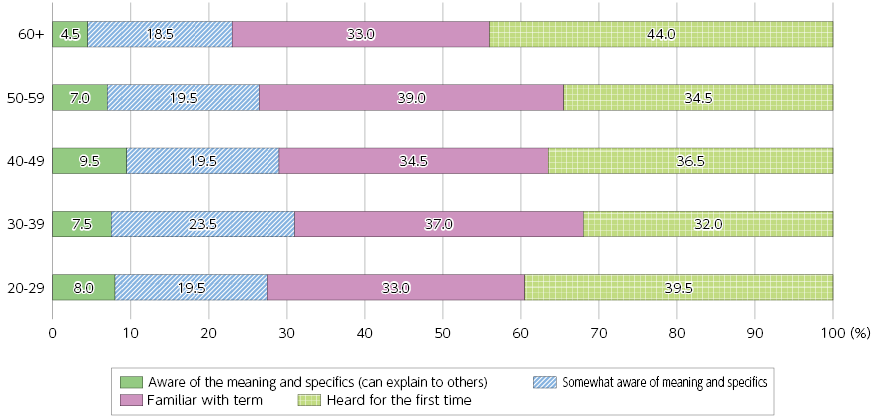
(Source) MIC (2023) “Survey Research on the Advancement of ICT Infrastructure and Distribution of Digital Data and Information”
- Experience of using a metaverse (by country) | (Figure 3-1-2-2 in White Paper)
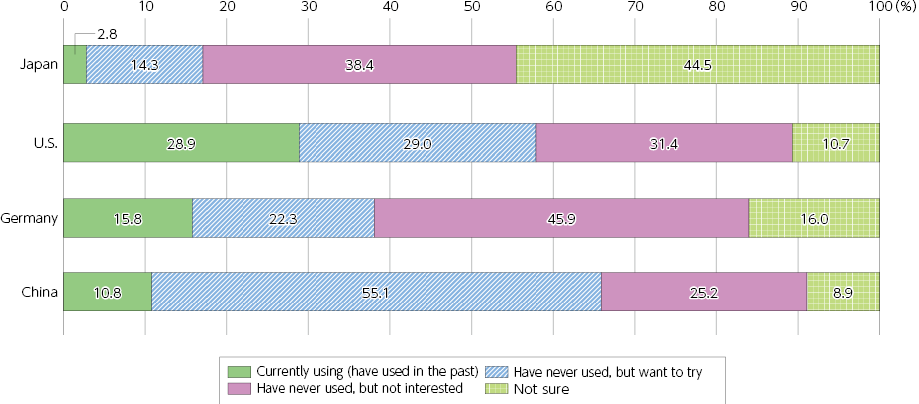
(Source) MIC (2023) “Survey Research on Advancement of ICT Infrastructure and Flow of Digital Data and Information”
- Metaverse School of Engineering, the University of Tokyo | (Figure 3-1-2-3 in White Paper)

(Source) The University of Tokyo
- Virtual Shibuya | (Figure 3-1-2-4 in White Paper)

(Source) Shibuya 5G Entertainment Project
- Metaversity (U.S.) | (Figure 3-1-2-5 in White Paper)

(Source) Publicly available information provided by VictoryXR, Inc. and others
- Metaverse Seoul (Korea) | (Figure 3-1-2-6 in White Paper)
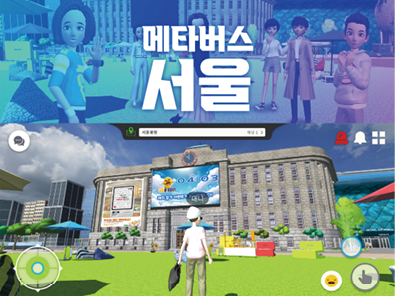
(Source) Publicly available information provided by Seoul City and others
- Promotion measures for metaverses in other countries | (Figure 3-1-2-7 in White Paper)
(Source) Based on Document 7-2 from the 7th meeting of the MIC Study Group on the Utilization of Metaverse Towards Web3 Era
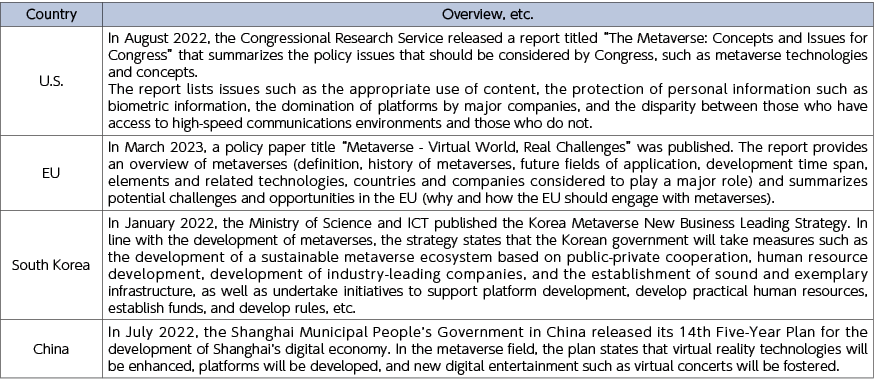
- VIRTUAL SHIZUOKA | (Figure 3-1-2-8 in White Paper)
(Source) Shizuoka Prefecture
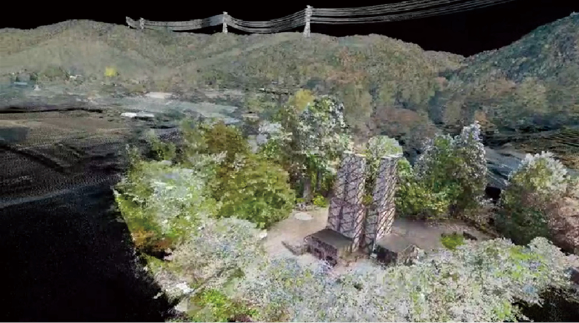
- Digital twin for hydroelectric systems (U.S.) | (Figure 3-1-2-9 in White Paper)
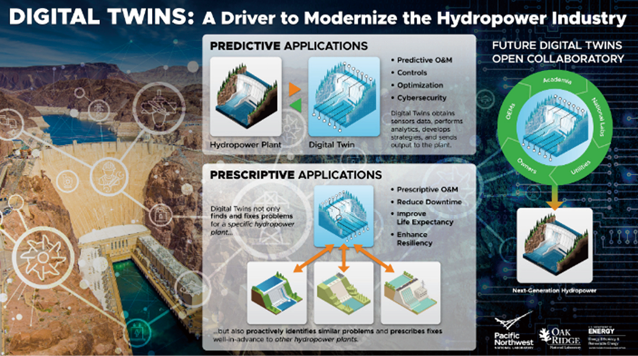
(Source) Oak Ridge National Laboratory HP
- Global market size of generative AI | (Figure 3-1-3-1 in White Paper)
(Source) Survey by Grand View Research Inc.
Chapter 3 - Section 2
- Examples of recent telecommunications services outages | (Figure 3-2-1-1 in White Paper)
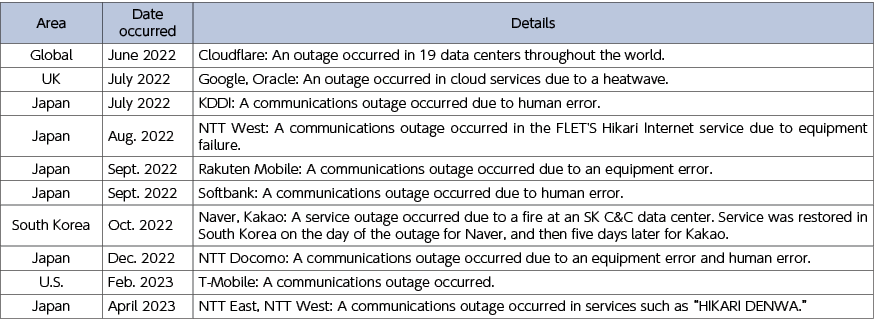
(Source) Created by MIC based on publicly available documents released by various companies
- Efforts by Japanese telecom operators to utilize and introduce satellites, etc. | (Figure 3-2-1-2 in White Paper)
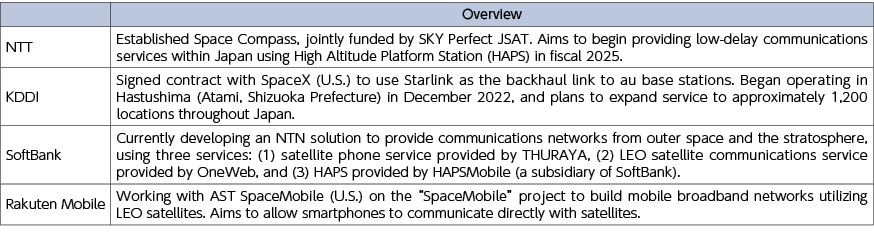
(Source) Created by MIC based on publicly available documents released by various companies
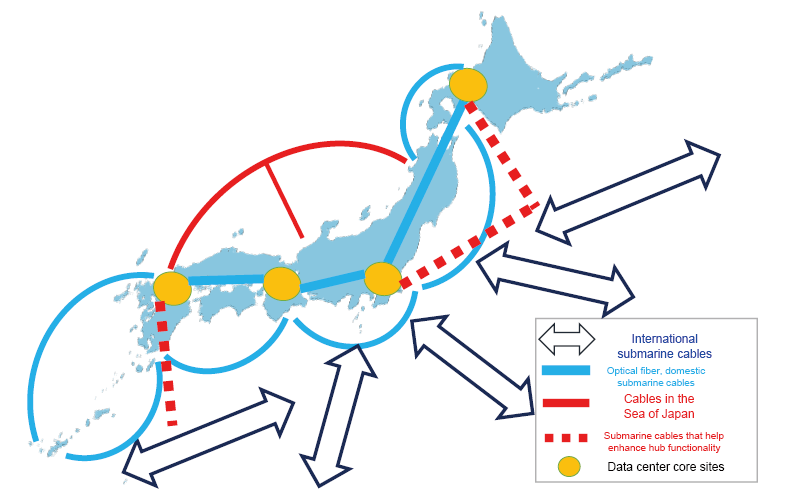
- Image of data center and submarine cables maintenance | (Figure 3-2-1-3 in White Paper)
- The ideal Beyond 5G network | (Figure 3-2-2-1 in White Paper)
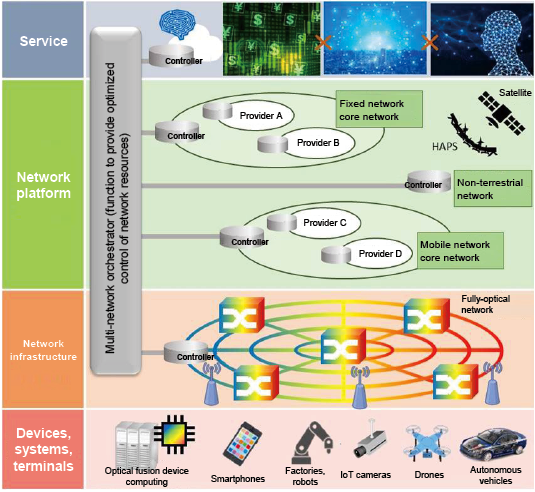
(Source) Summary of the Information and Communications Council's interim report on the “Information and Communications Technology Strategy Beyond 5G”
Column
- Internet shutdowns in the world | (Figure 1 in White Paper)
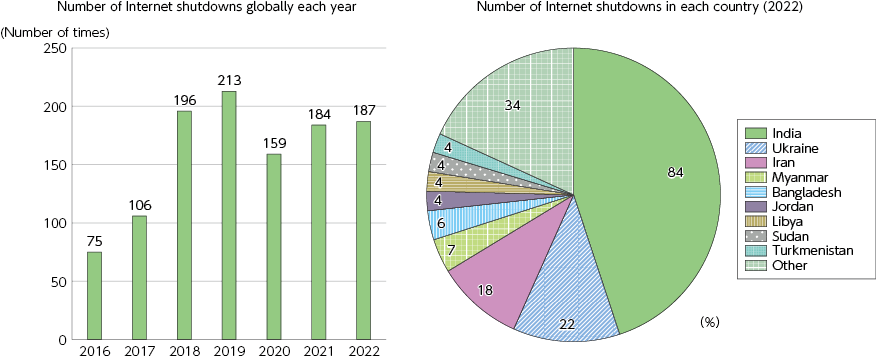
(Source) Created based on “WEAPONS OF CONTROL, SHIELDS OF IMPUNIT”
Chapter 4 - Section 1
- Structure of the ICT market by layer | (Figure 4-1-1-1 in White Paper)
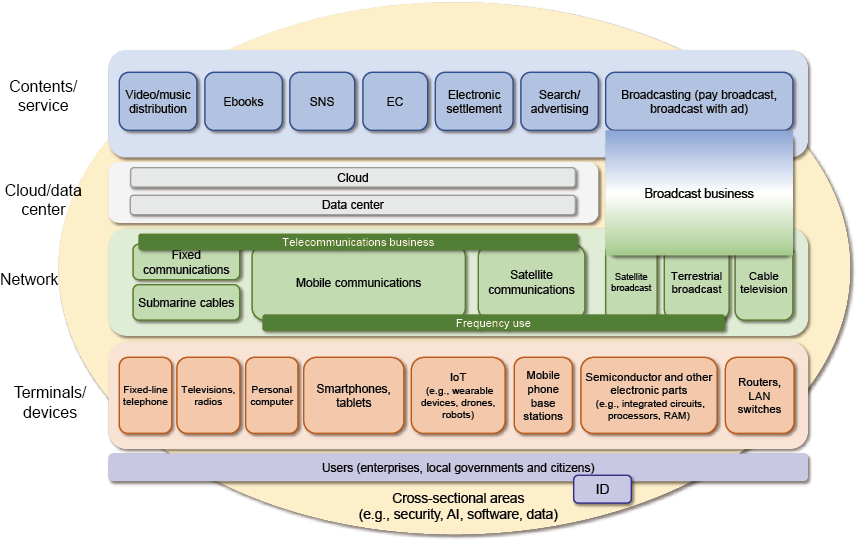
(Source) Created by MIC
- Changes in global ICT market size (in terms of expenditure) | (Figure 4-1-1-2 in White Paper)
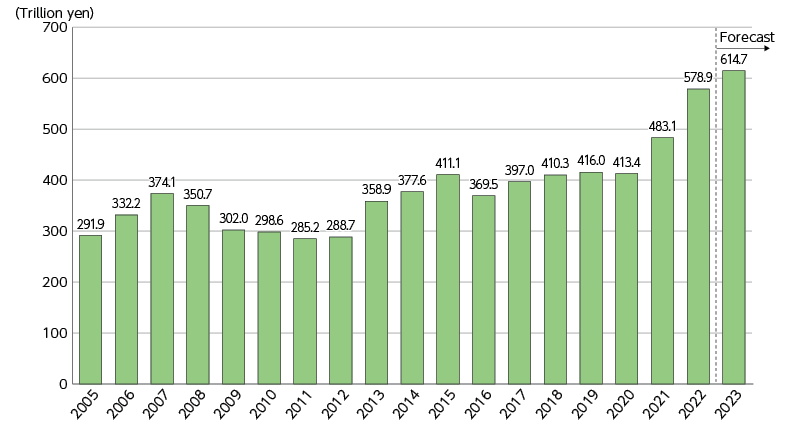
(Source) Statista (Gartner)
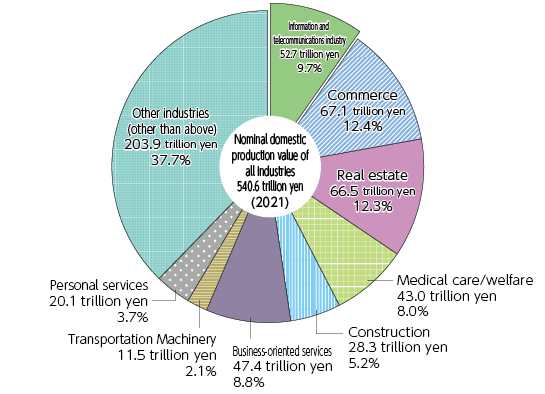
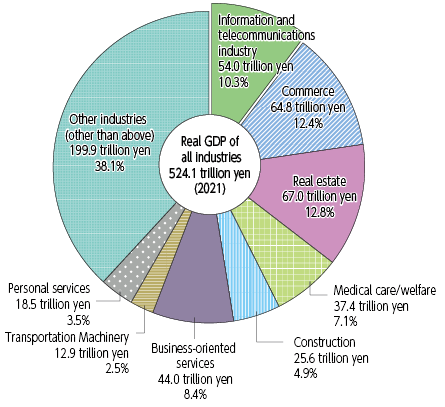
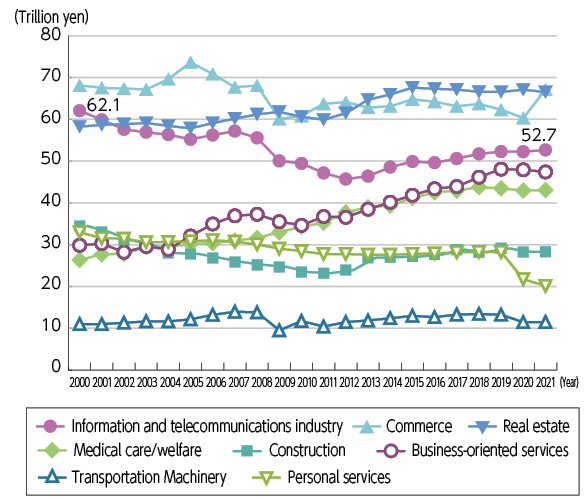
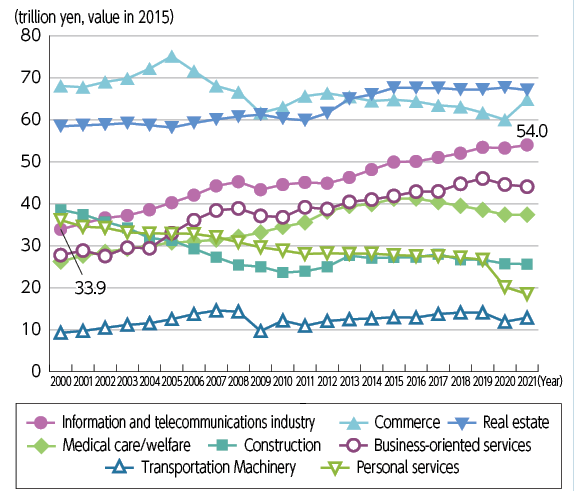
- Nominal and real domestic production values of major industries (breakdown of 2021)
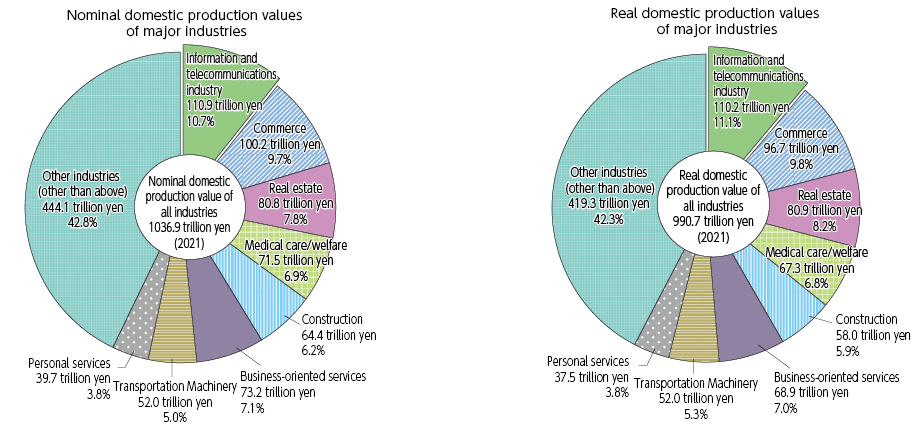
*1 Real domestic production value is calculated using the 2015 prices.
*2 For scope of the information and communications industry, see Annotation 3 of the Appendix.
(Source) MIC (2023), “Fiscal 2022 Survey on economic analysis of ICT”
- Changes in domestic production value of major industries (nominal and real)
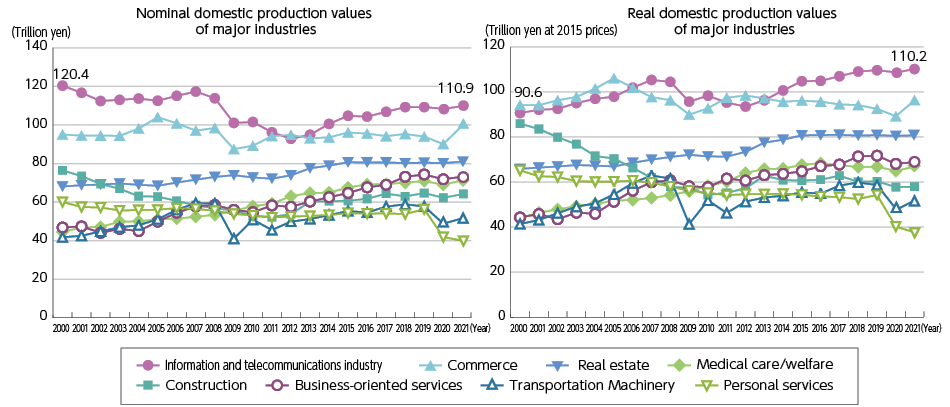
(Source) MIC (2023), “Fiscal 2022 Survey on economic analysis of ICT”
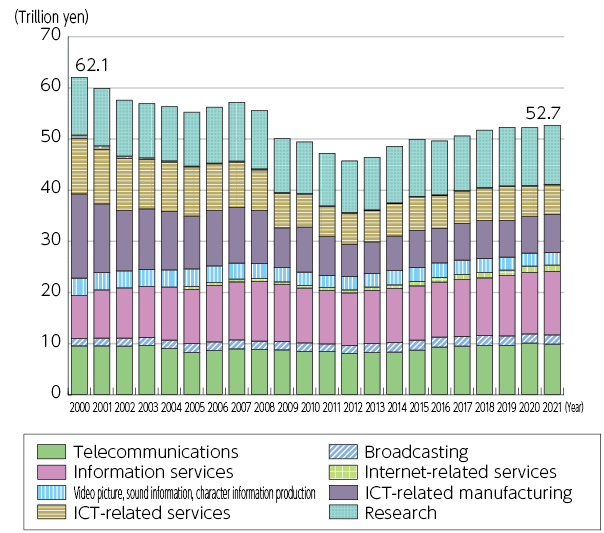
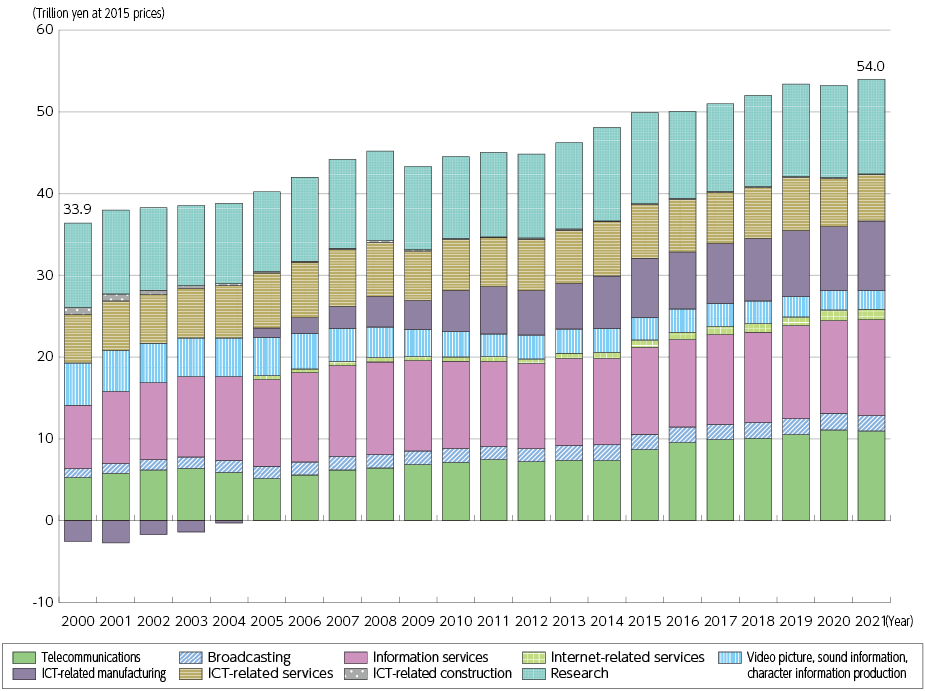
- Changes in domestic production value of the information and communication industry (nominal and real)*
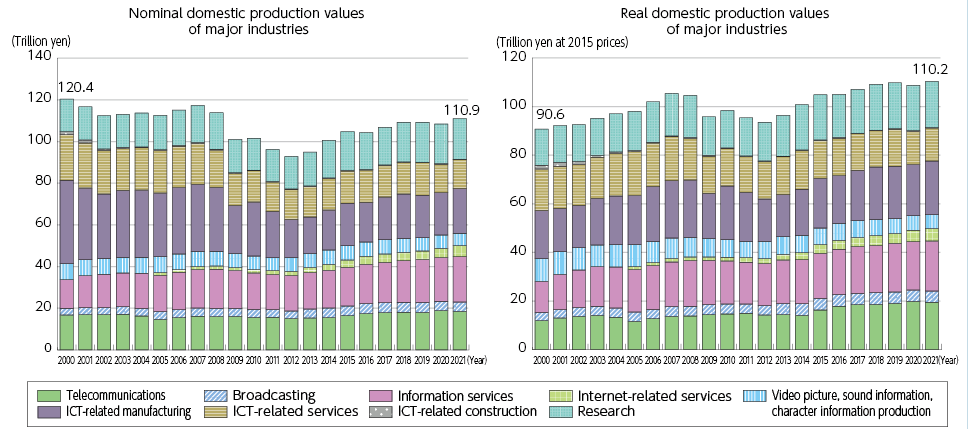
*For the details of the values, see Data 2 and Data 3 of the Appendix.
(Source) MIC (2023), “Fiscal 2022 Survey on economic analysis of ICT”
- GDP of major industries (nominal) | (Figure 4-1-2-1 in White Paper)
(Source) MIC (2023) “Survey on Economic Analysis of ICT in Fiscal 2022”
- GDP of major industries (real)
*Real GDP converted at 2015 prices.
(Source) MIC (2023), “2022 Survey on economic analysis of ICT”
- Changes in nominal GDP of major industries | (Figure 4-1-2-2 in White Paper)
(Source) MIC (2023) “Survey on Economic Analysis of ICT in Fiscal 2022”
- Changes in GDP of major industries (real)
(Source) MIC (2023), “2022 Survey on economic analysis of ICT”
- Changes in nominal GDP of the ICT industry | (Figure 4-1-2-3 in White Paper)
(Source) MIC (2023) “Survey on Economic Analysis of ICT in Fiscal 2022”
- Changes in GDP of the information and communication industry (real)
*For the details of the values, see Data 5 of the Appendix.
(Source) MIC (2023), “Fiscal 2022 Survey on economic analysis of ICT”
- Changes in IT investment in Japan | (Figure 4-1-3-1 in White Paper)
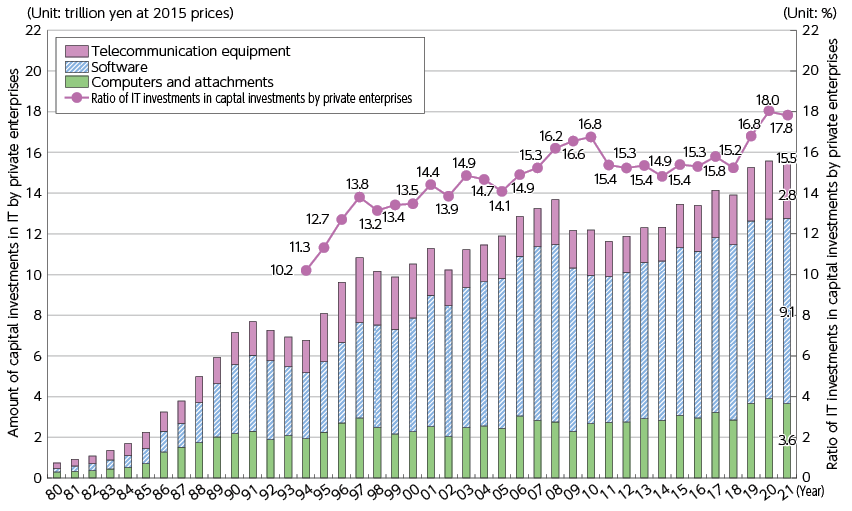
(Source) MIC (2023) “Survey on Economic Analysis of ICT in Fiscal 2022”
- Comparison of IT investments in the private sector in Japan and the U.S. | (Figure 4-1-3-2 in White Paper)
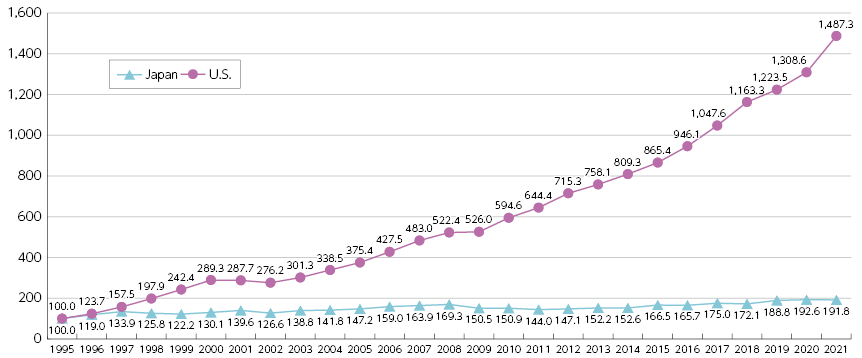
*1995 = indexed as 100 (Japan: 2015 price; U.S.: 2012 price)
(Source) MIC (2023) “Survey on Economic Analysis of ICT in Fiscal 2022”
- Changes in the value of imports and exports of goods and services (nominal) | (Figure 4-1-4-1 in White Paper)
(Source) Prepared based on the MIC “ICT Industry Linkage Table” (for each fiscal year)
- Changes in exports/imports of goods/services (real)
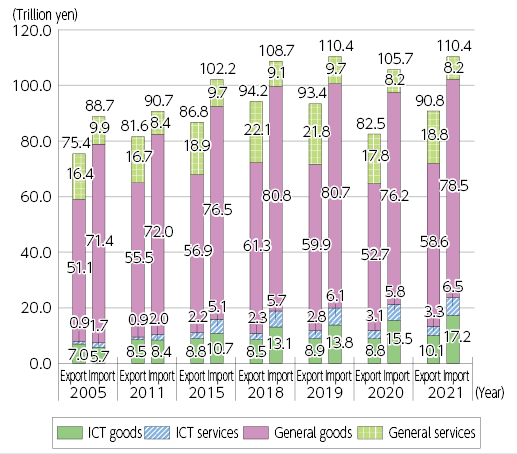
*Real value is calculated using the 2015 prices.
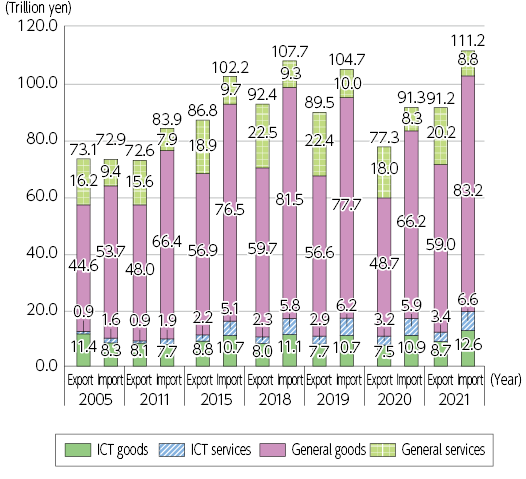
- Changes in the value of imports and exports of ICT goods and services (nominal) | (Figure 4-1-4-2 in White Paper)
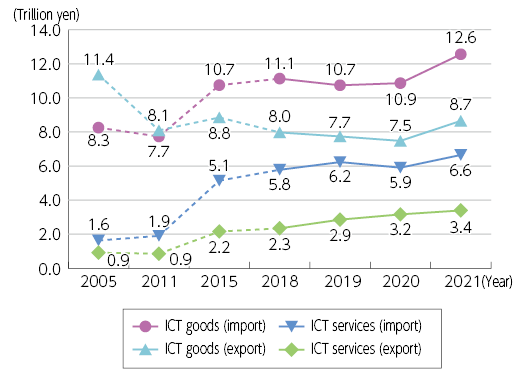
*There are different blanks in the data from 2005 to 2018 so trends are shown using dashed lines.
(Source) Prepared based on the MIC “ICT Industry Linkage Table” (for each fiscal year)
- Changes in exports and imports of ICT goods/services (Real value)
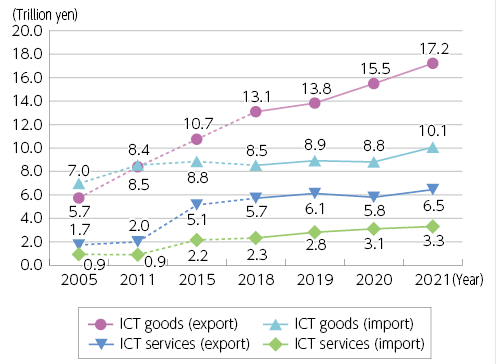
*The transition from 2005 to 2018 is indicated by a dashed line because there is a gap in the period.
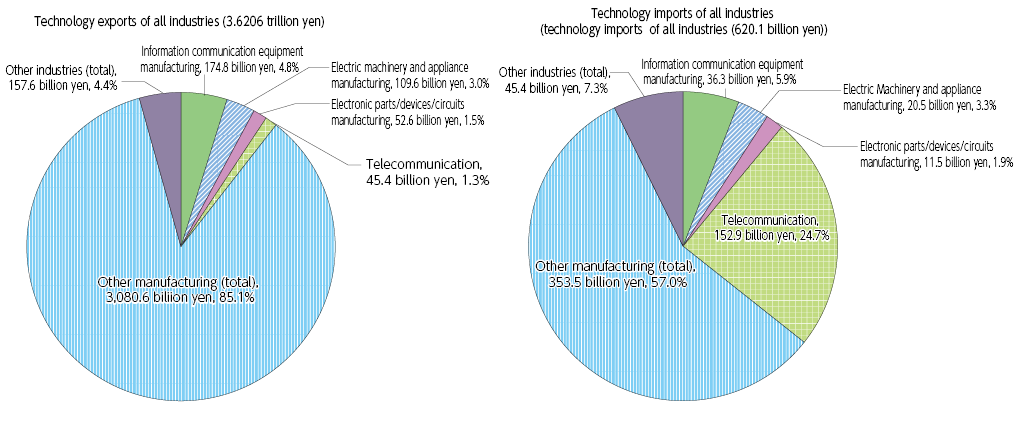
- Proportion of technology trade values by industry (fiscal 2021)
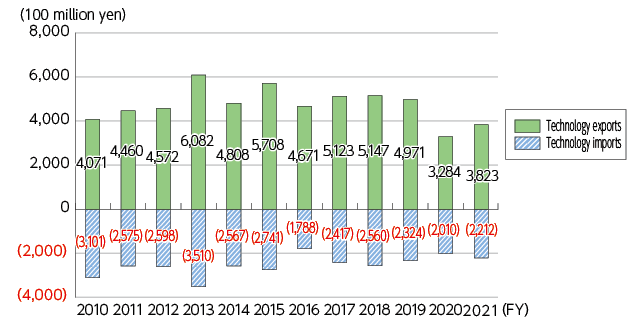
- Changes in technology trade values of the information and communication industry
- Percentages of research expenditure by companies (fiscal 2021) | (Figure 4-1-5-1 in White Paper)
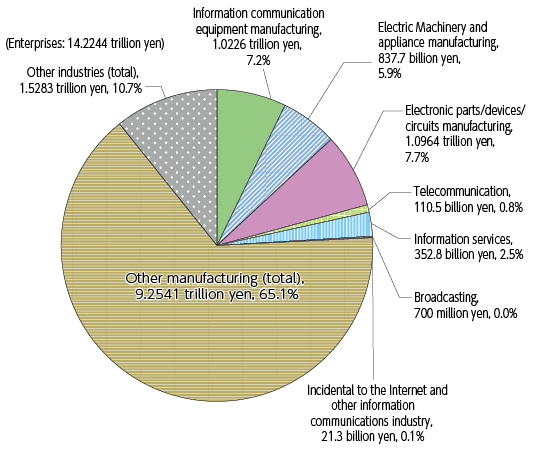
(Source) Prepared based on the MIC “2022 Science and Technology Research Survey”
- Changes in research expenditure by companies | (Figure 4-1-5-2 in White Paper)
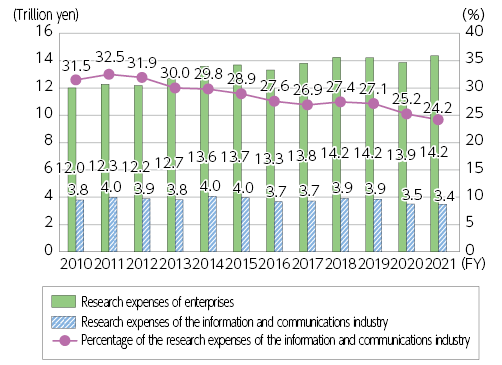
(Source) Prepared based on the MIC “Science and Technology Research Survey” for each fiscal year
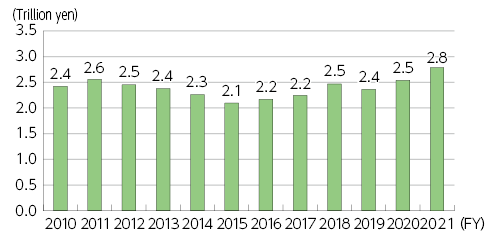
- Changes in research expenses in the information and communications sector
- Changes in the number of researchers at companies | (Figure 4-1-5-3 in White Paper)
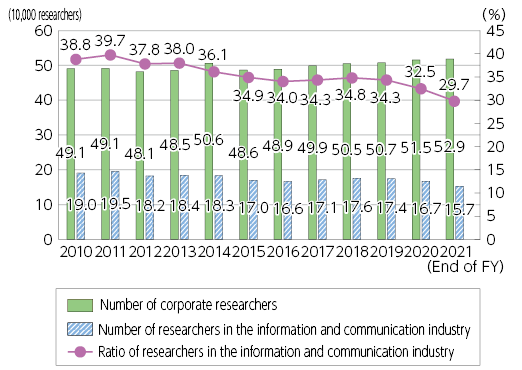
(Source) Prepared based on the MIC “Science and Technology Research Survey” for each fiscal year
- Percentages of the number of researchers at companies by industry (as of March 31, 2022)
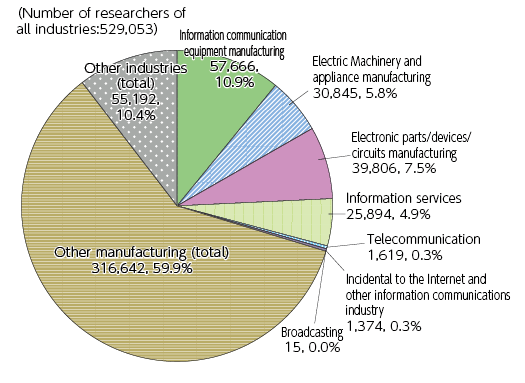
(Source) Prepared based on the MIC “2022 Science and Technology Research Survey”
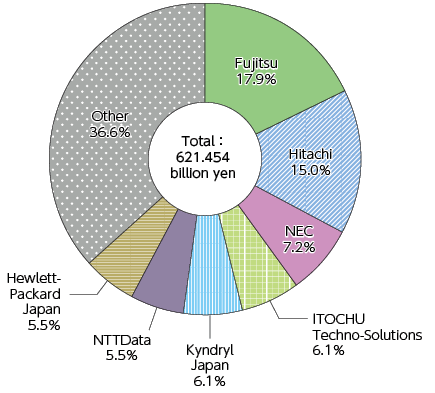
- Comparison of research and development expenditures by telecommunications carriers, communications devices and IT service providers (2021) | (Figure 4-1-5-5 in White Paper)
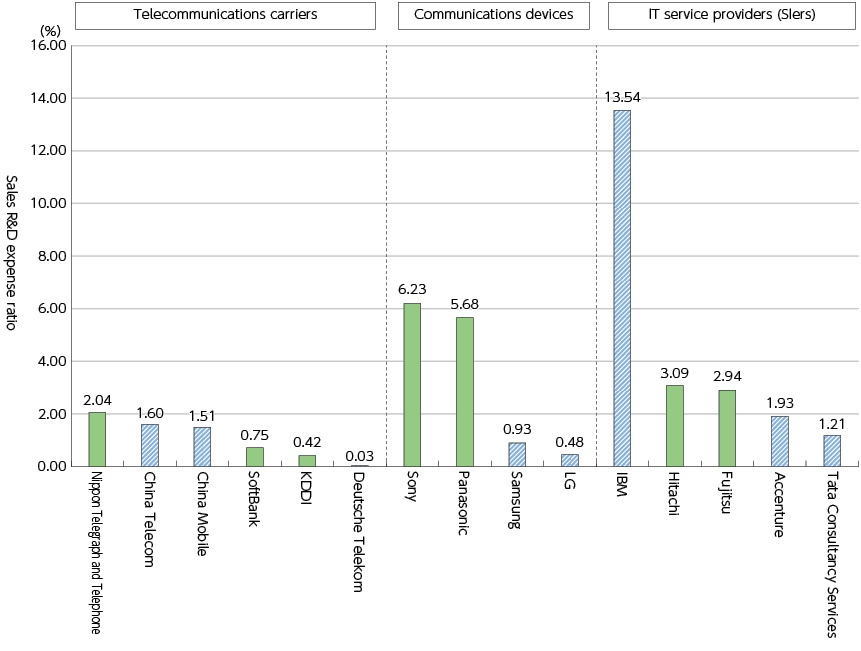
(Source) Prepared based on the annual reports released by companies
- Comparison of research and development expenditures between major Japanese companies and GAFAM (2021) | (Figure 4-1-5-6 in White Paper)
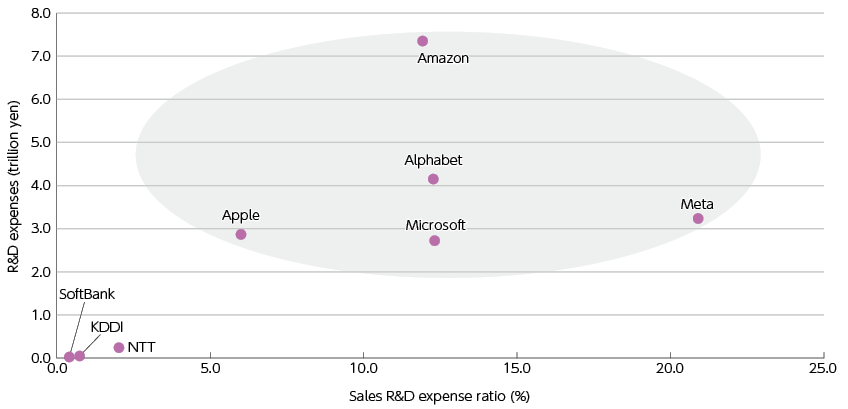
(Source) Prepared based on the annual reports released by companies
- Changes in the number of employees of the information and communication industry
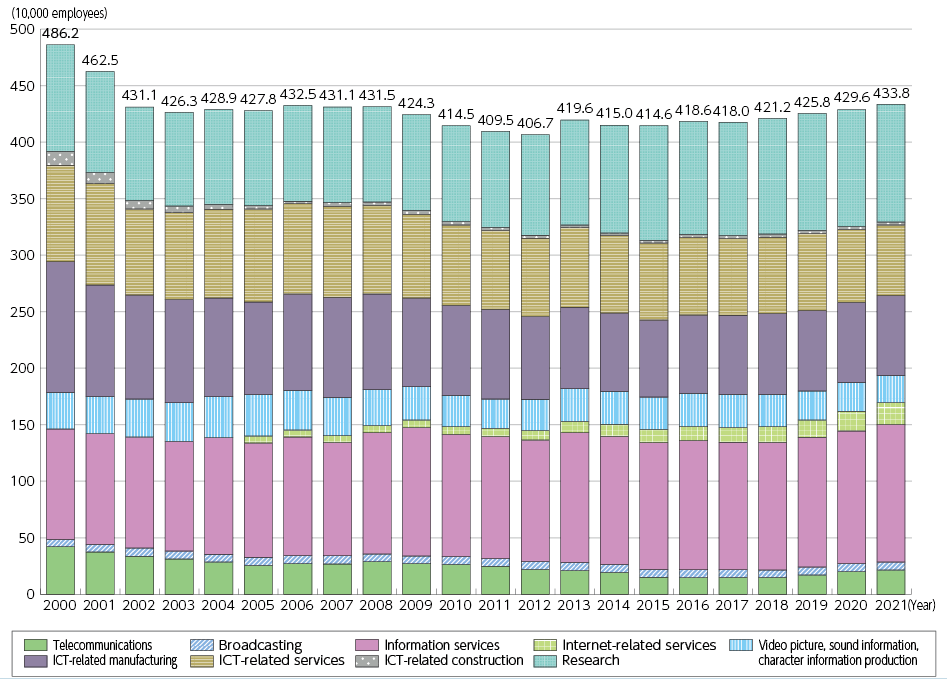
*For the details of the values, see Data 6 of the Appendix.
(Source) MIC (2023), “Fiscal 2022 Survey on economic analysis of ICT”
- Changes in the economic ripple effects (induced added values and number of employments) of production activities of major industry sectors
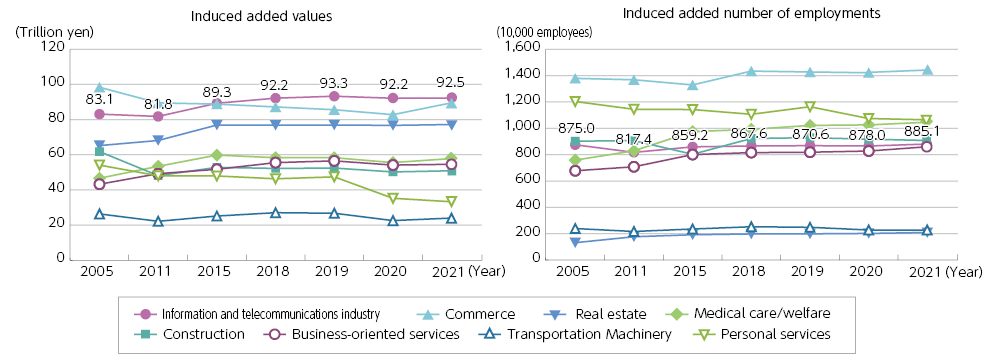
(Source) MIC (2023), “Fiscal 2022 Survey on economic analysis of ICT”
- Contribution of the information and communications industry to the real GDP growth rate
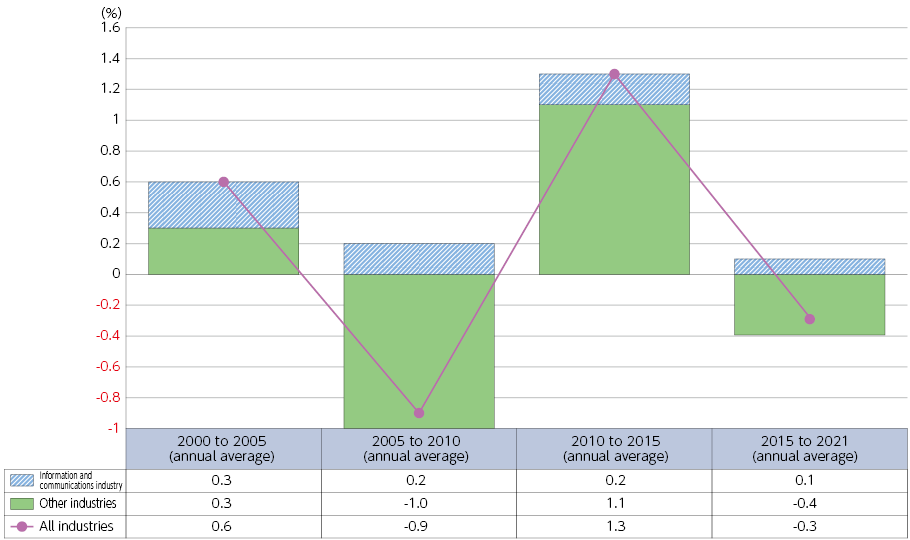
(Source) MIC (2023), “Fiscal 2022 Survey on economic analysis of ICT”
Chapter 4 - Section 2
- Changes in fixed broadband service subscriptions in major countries | (Figure 4-2-1-1 in White Paper)
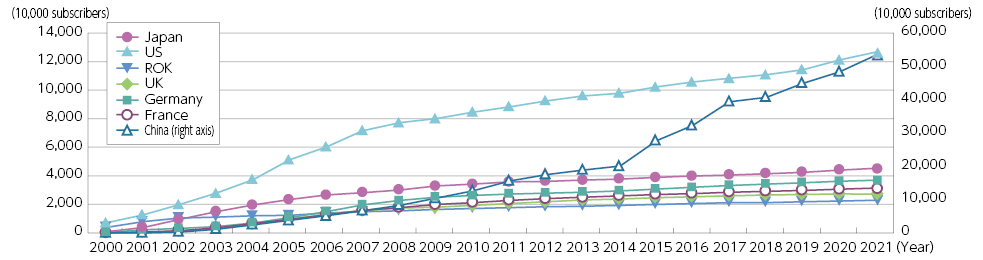
(Source) ITU
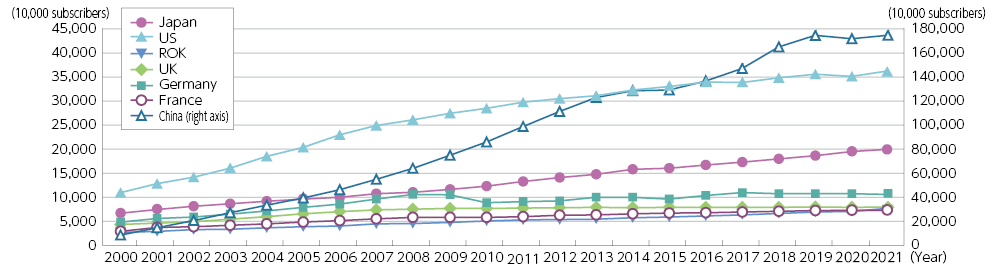
- Changes in the number of mobile phone subscriptions in major countries | (Figure 4-2-1-2 in White Paper)
- Composition of sales in the telecommunications industry | (Figure 4-2-2-1 in White Paper)
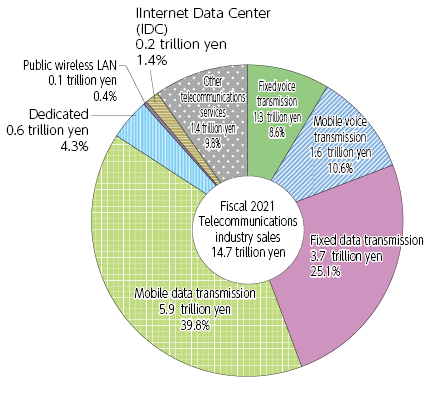
*1 Fixed voice transmission is the sum of domestic and international services.
*2 Fixed data transmission includes sales through Internet access (ISP, FTTH, etc.), IP-VPN, and wide area Ethernet.
(Source) Prepared based on the MIC “Basic Survey on the Information and Communications Industry”
- Changes in the number of telecommunications carriers | (Figure 4-2-2-2 in White Paper)
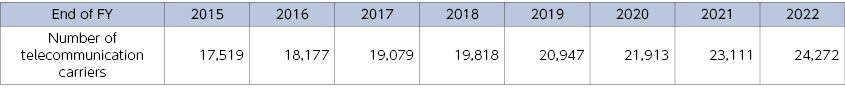
(Source) Information and Communications Statistics Database
- State of preparation of optical fiber as of March 31, 2022 (estimated) | (Figure 4-2-2-3 in White Paper)
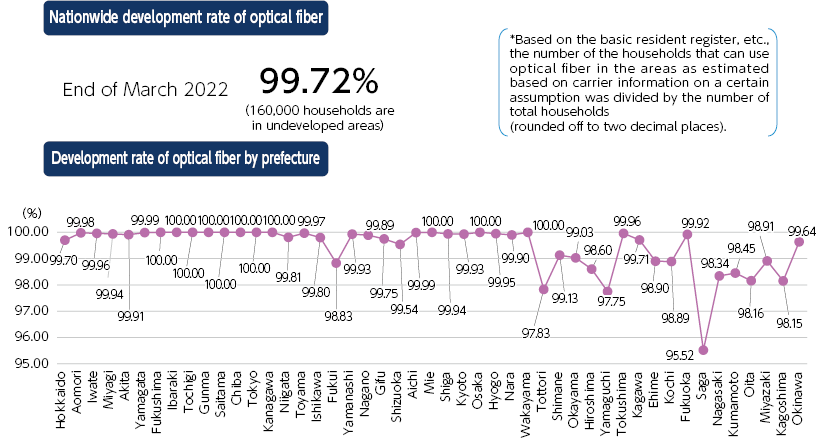
(Source) MIC “Survey on Broadband Infrastructure Coverage Rate at End of Fiscal 2021”
- Percentage of optical fiber in fixed broadband in OECD member countries
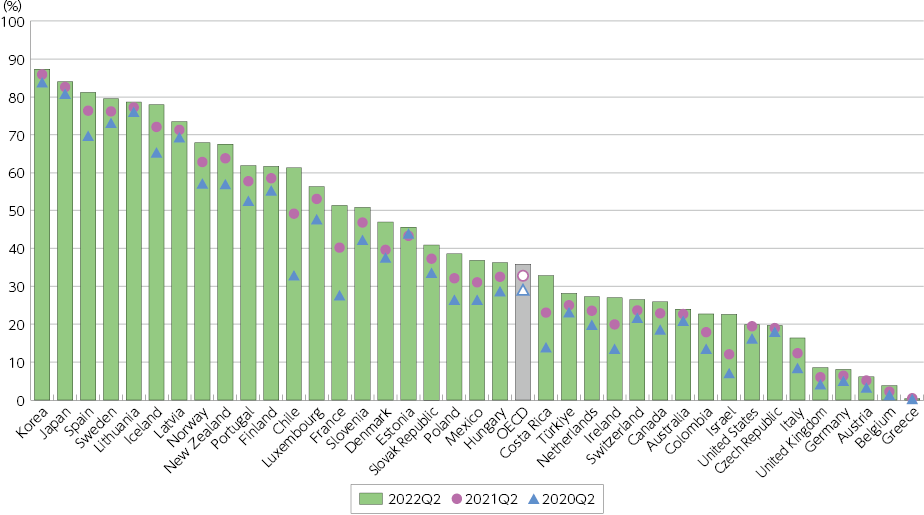
(Source) OECD Broadband statistics. 1.10. Percentage of fiber connections in total fixed broadband, June 2022
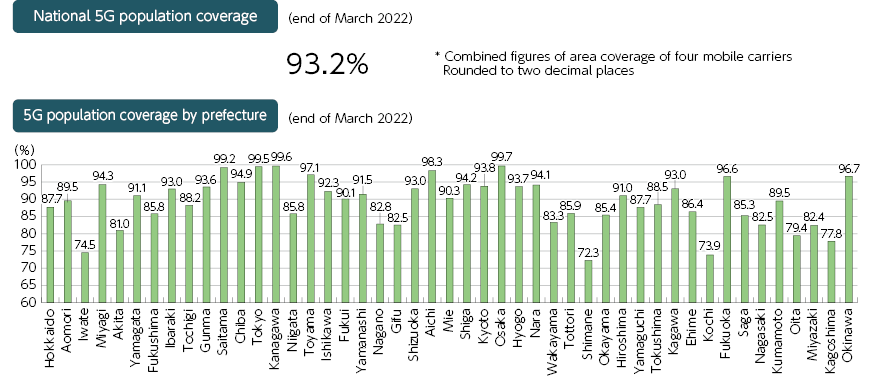
- Japan’s 5G coverage as percentage of population (as of end of March 2022) | (Figure 4-2-2-4 in White Paper)
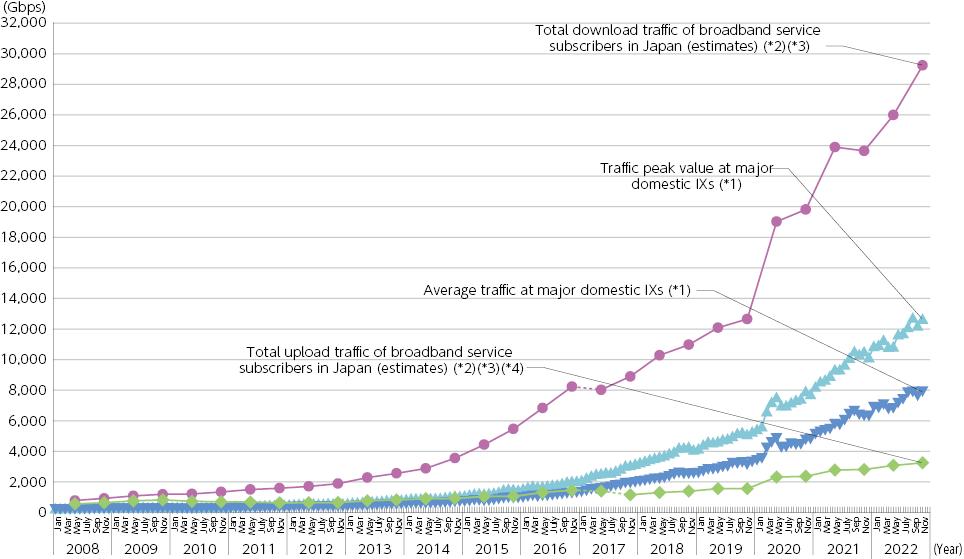
- Changes in Internet traffic (fixed systems, mobile systems, download traffic) | (Figure 4-2-2-5 in White Paper)
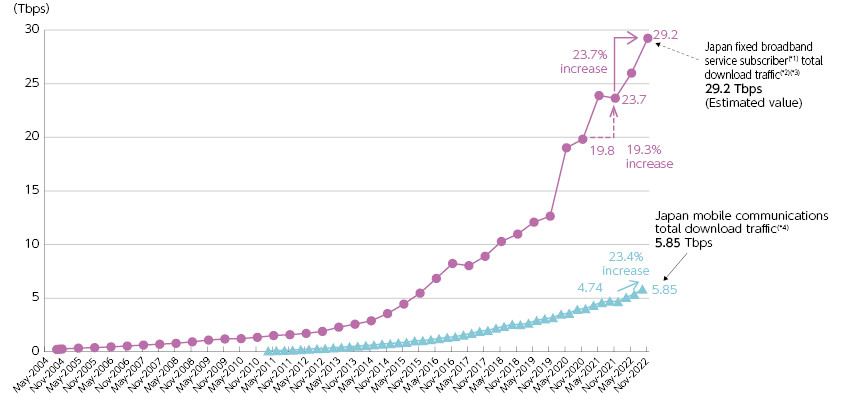
*1 Services for individuals (FTTH, DSL, CATV, FWA) (including some corporations)
*2 Prior to May 2011, this also includes some mobile communications traffic to and from mobile phone networks.
*3 Since May 2017, the number of cooperating ISPs increased from five to nine, resulting in discontinuities due to aggregated and estimated values based on information from the nine ISPs.
*4 From “MIC Current State of Mobile Communications Traffic in Japan (Sept. 2022)” (measured in March, June, Sept., and Dec.)
(Source) MIC (2023) “Results of Aggregating Internet Traffic in Japan (for November 2022)”
- Totalization and trial calculation of internet traffic in Japan*1*2
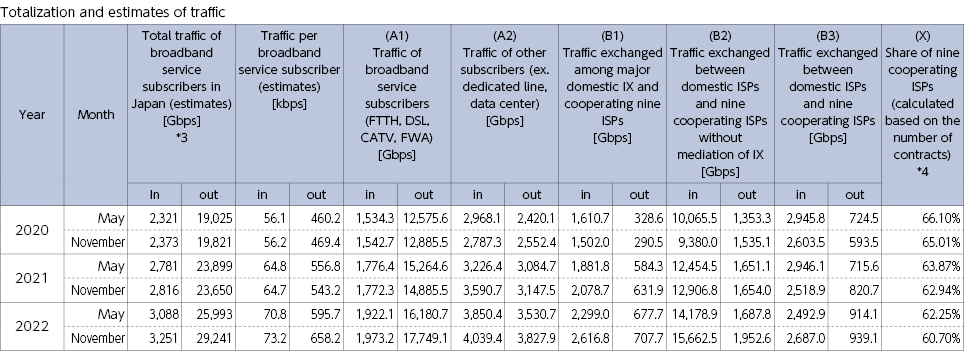
*1 In “Total traffic of broadband service subscribers in Japan (estimates)”, “Traffic per broadband service subscriber (estimates)”, A1 and A2, “in” corresponds to “upload” while “out” corresponds to “download”.
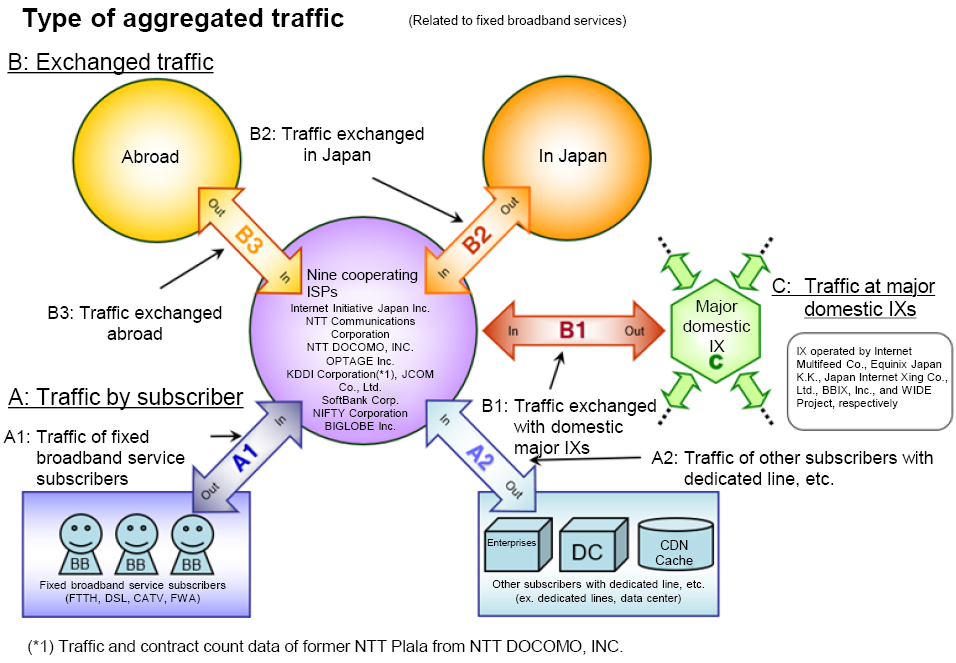
*2 Aggregate and estimated values of nine cooperating ISPs (Internet Initiative Japan Inc. (IIJ), NTT Communications Corporation, NTT DOCOMO, INC. (formerly NTT Plala), OPTAGE Inc., KDDI Corporation, JCOM Co., Ltd., SoftBank Corp., NIFTY Corporation, and BIGLOBE Inc.).
*3 Total traffic of broadband service subscribers in Japan (estimates) is calculated based on the traffic of broadband subscribers of nine cooperating ISPs (A1) and their share of subscribers (X).
*4 Estimation by linear interpolation based on the “publication of quarterly data on the number and share of telecommunication service contracts”
- Totalization and trial calculation of internet traffic in Japan*1*2
*1 In “Total traffic of broadband service subscribers in Japan (estimates)”, “Traffic per broadband service subscriber (estimates)”, A1 and A2, “in” corresponds to “upload” while “out” corresponds to “download”.
*2 Aggregate and estimated values of nine cooperating ISPs (Internet Initiative Japan Inc. (IIJ), NTT Communications Corporation, NTT DOCOMO, INC. (formerly NTT Plala), OPTAGE Inc., KDDI Corporation, JCOM Co., Ltd., SoftBank Corp., NIFTY Corporation, and BIGLOBE Inc.).
*3 Total traffic of broadband service subscribers in Japan (estimates) is calculated based on the traffic of broadband subscribers of nine cooperating ISPs (A1) and their share of subscribers (X).
*4 Estimation by linear interpolation based on the “publication of quarterly data on the number and share of telecommunication service contracts”
- Changes in the internet traffic in Japan
*1 Before December 2010: traffic at three major IXs (WIDE Project (NSPIXP),) Japan Internet Exchange Co. (JPIX) and Internet Multifeed Co. (JPNAP)); In January 2011 and after: traffic at three IXs above plus additional two IXs (BBIX Inc. and Equinix Japan K.K.)
*2 Before May 2011, a part of mobile communication traffic with mobile telephone network was included in the traffic between some cooperating ISPs and broadband service subscribers. Because exclusion of the traffic concerned from calculation became possible, traffic has been aggregated and calculated without the traffic concerned since November 2011.
*3 Data is discontinuous because number of cooperating ISPs increased from 5 to 9 in May 2017 and total values and estimates have been based on the nine ISPs since then.
*4 Data is discontinuous due to a review of measurement method by some of the cooperating business operators during the period from May to November 2017.
- Changes in download traffic of broadband subscribers with nine ISPs
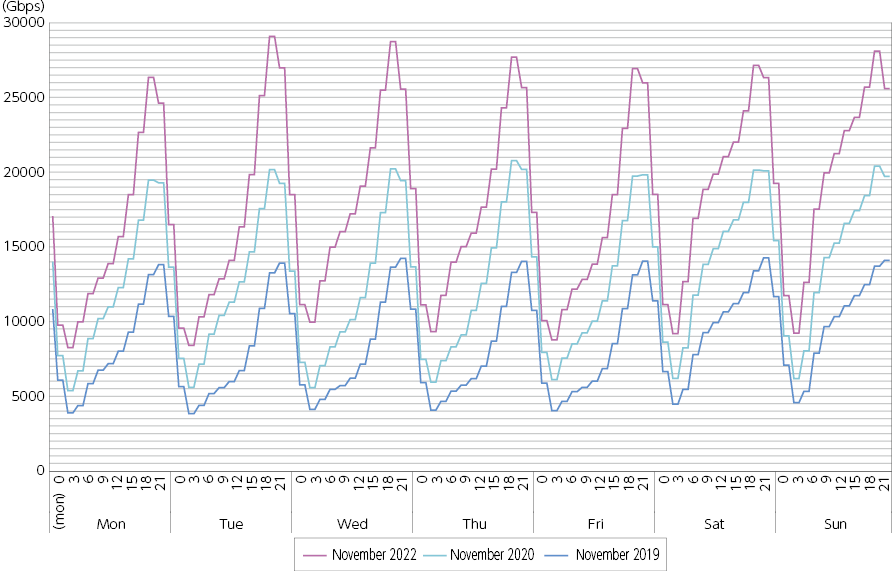
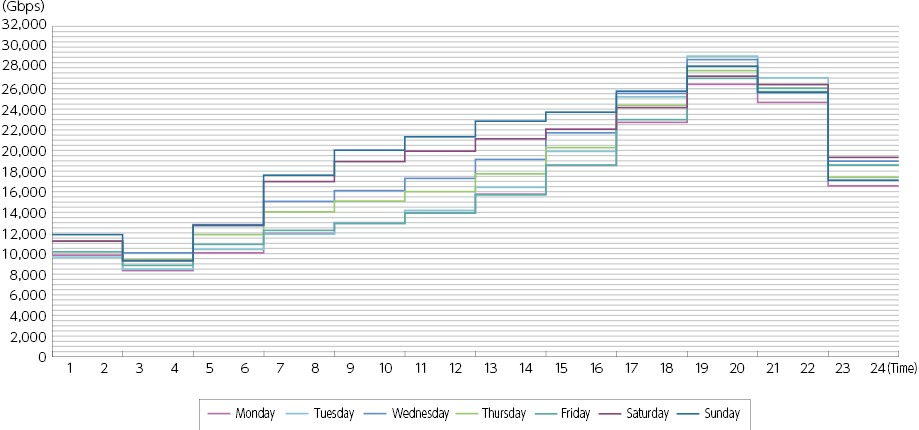
- Changes in traffic of broadband subscribers with nine ISPs by day of week
- Changes in the number of broadband subscriptions | (Figure 4-2-2-6 in White Paper)
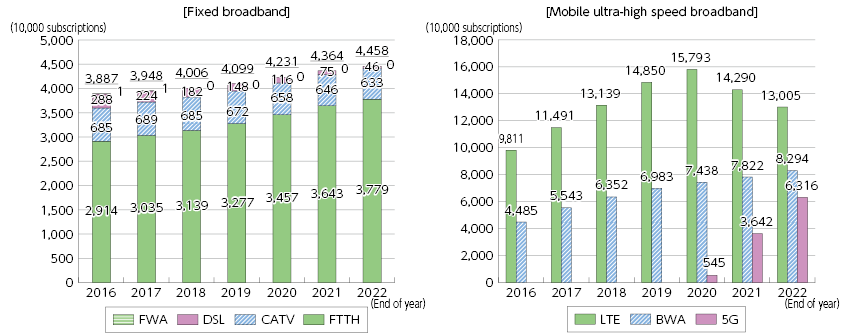
*The figures for the past differ from those published last year due to revisions in business operator reports.
(Source) Prepared based on the MIC “Quarterly data on the number and share of subscriptions to telecommunications services (Fiscal 2022 Q3 (End of December))”
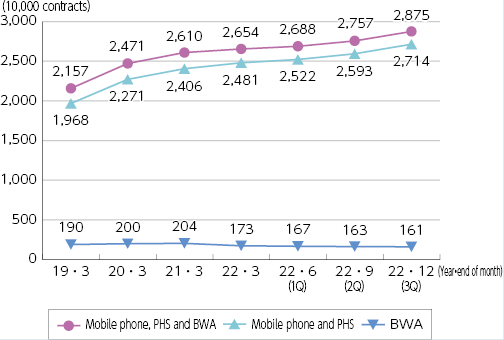
- Changes in the number of subscriptions to voice communications services | (Figure 4-2-2-7 in White Paper)
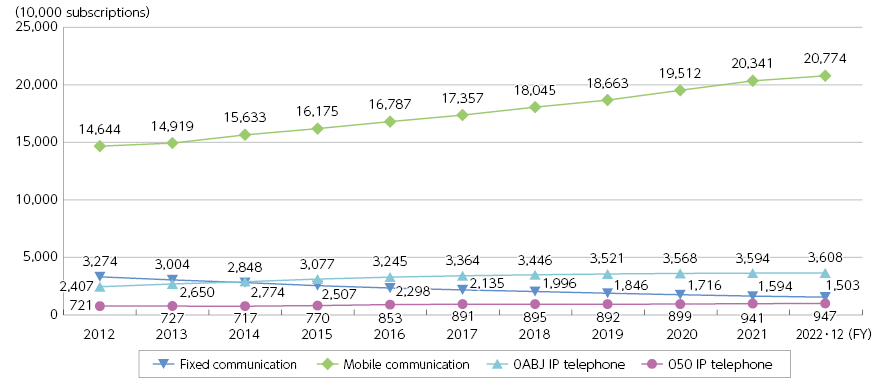
*1 For fiscal 2022, data up to the end of December was used, so care must be taken when comparing over time.
*2 Mobile communications is the sum of mobile phones, PHS, and BWA.
*3 For mobile communications since fiscal 2013, figures are adjusted for intra-group transactions. Adjusted for intragroup transactions means when an MNO receives mobile phone and BWA services as an MVNO from another MNO in the same group and then provides them together with their own services on a single mobile phone, etc., the contracts are counted as one contract instead of two contracts.
(Source) Prepared based on the MIC “Publication of quarterly data on the number and share of subscriptions to telecommunications services (Fiscal 2022 Q3 (End of December))”
- Changes in net increase of FTTH and DSL contracts (compared with the end of the previous quarter)
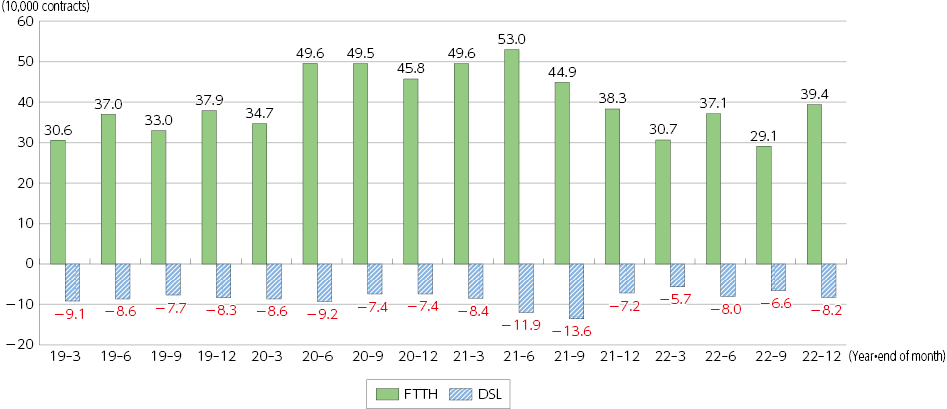
*Past values are different from the past published values due to correction of the report by the business operators.
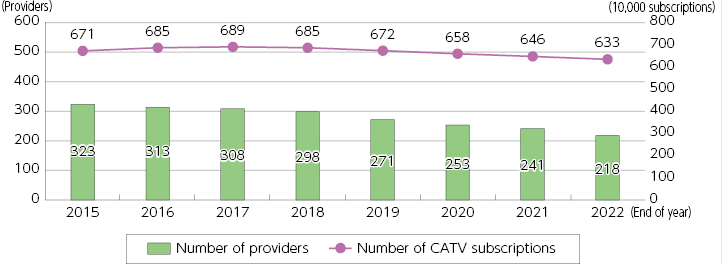
- Changes in the number of CATV providers and subscriptions
- Changes in the number of subscribers with fixed telephone
*For fiscal 2022, data up to the end of December was used, so care must be taken when comparing over time.
- Changes in the composition of public telephone facilities of NTT East/West
(Source) Prepared from materials of NTT East/West
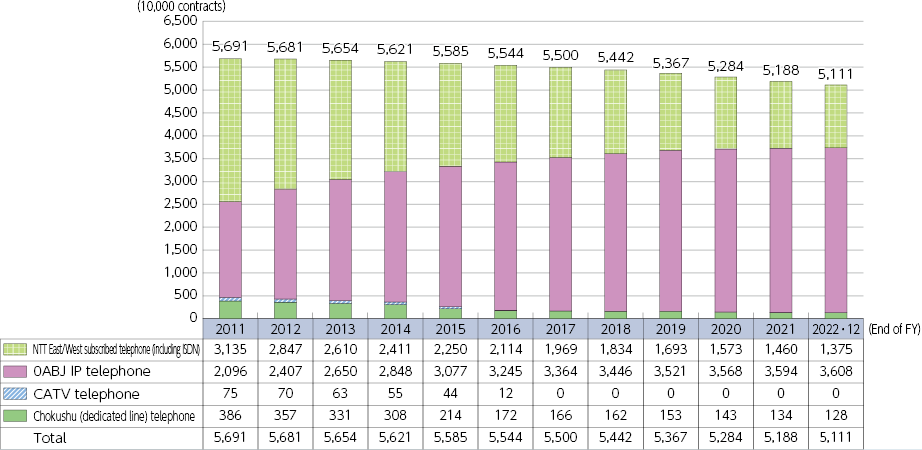
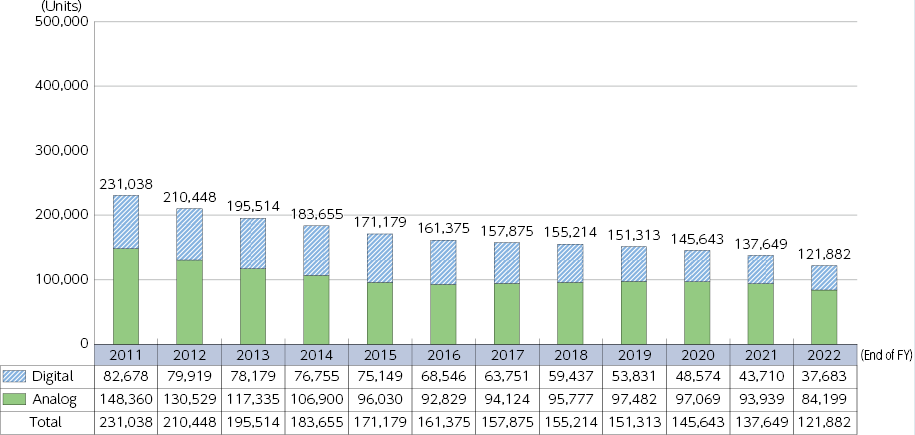
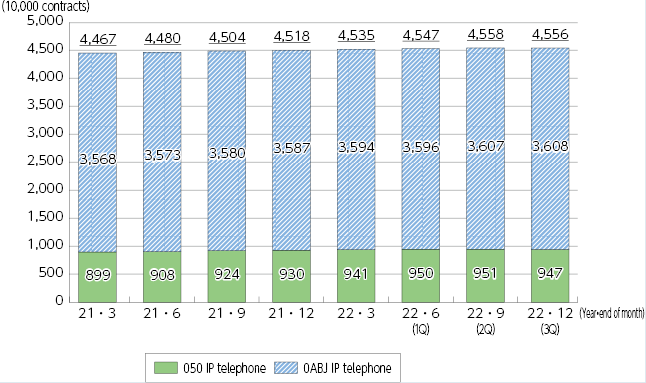
- Usage status of IP telephone
- Changes in the number of mobile communication contracts
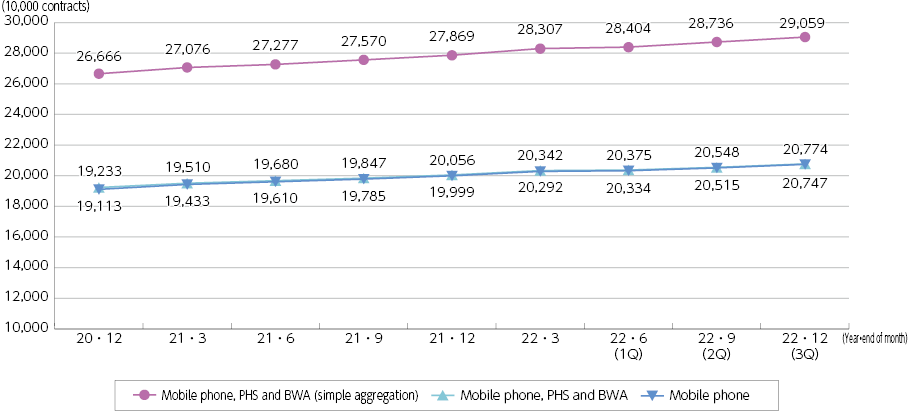
*Unless otherwise stated, the figures for the number of contracts have been adjusted for intra-group transactions. Items indicated as “simple aggregation” are figures that have not been adjusted for intra-group transactions.
*“Adjusted for intragroup transactions” means when an MNO receives mobile phone and BWA services as an MVNO from another MNO in the same group and then provides them together with their own services on a single mobile phone, etc., the contracts are counted as one contract instead of two contracts. Counted as one contract.
*Past values are different from the values published last year due to correction of the report by the business operators.
- Changes in share of mobile communications subscriptions (adjusted for intra-group transactions) by business operator | (Figure 4-2-2-8 in White Paper)
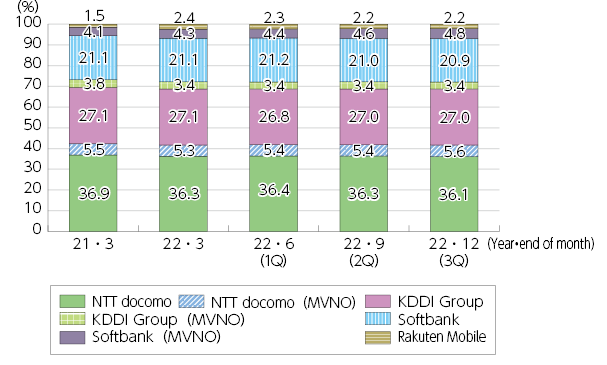
*1 Adjusted for intragroup transactions means when an MNO receives mobile phone and BWA services as an MVNO from another MNO in the same group and then provides them together with their own services on a single mobile phone, etc., the contracts are counted as one contract instead of two contracts.
*2 The share of the KDDI Group includes KDDI, Okinawa Cellular and UQ Communications.
*3 The share of MVNOs is calculated by MNO group that provides services and is indicated by the supplementary note (MVNO) after the name of the MNO group.
*4 Rakuten Mobile's share as an MNO. MVNO services provided by Rakuten Mobile are included in NTT DOCOMO (MVNOs) and KDDI Group (MVNOs).
(Source) Prepared based on the MIC “Publication of quarterly data on the number and share of subscriptions to telecommunications services (Fiscal 2022 Q3 (End of December))”
- Changes in number of MVNO contracts (excluding MVNOs that are MNOs)
- Changes in the number of IP-VPN service and wide-area ethernet service contracts
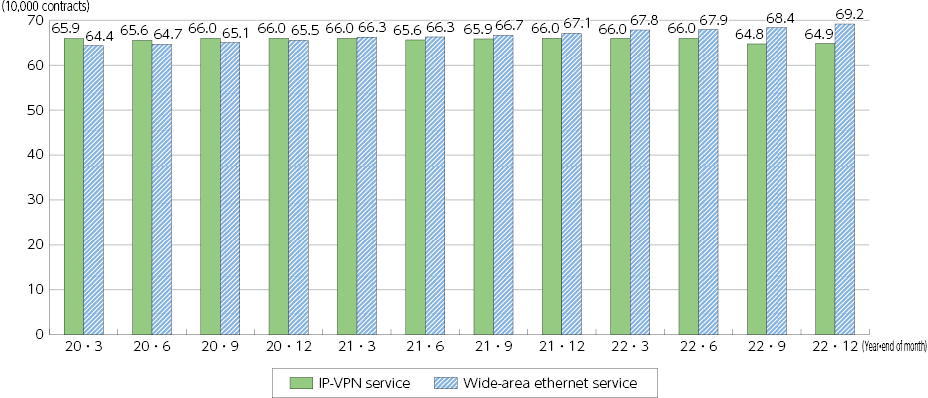
*Past values are different from the values published last year due to correction of the report by the business operators.
- International comparison of mobile phone charges by model (fiscal 2022)
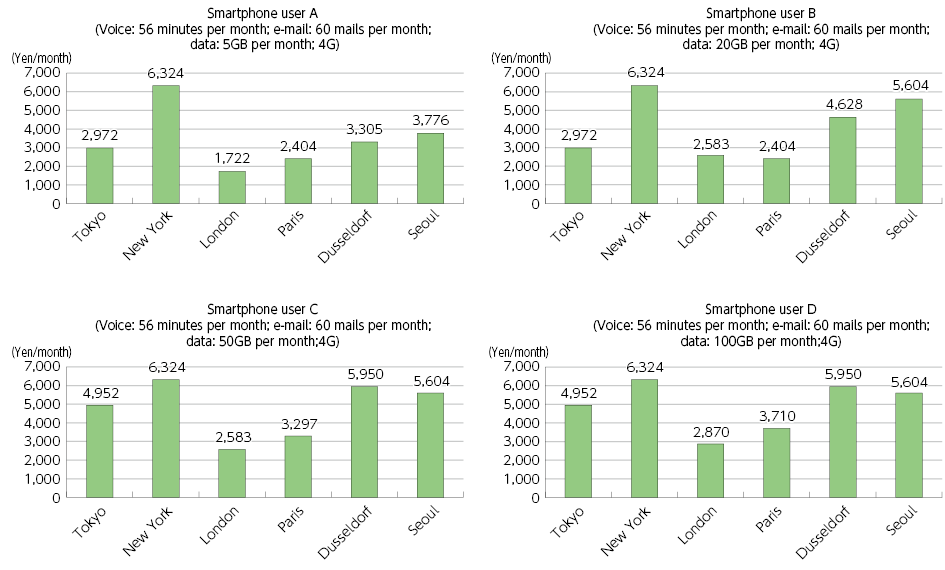
(Source) MIC “FY2022 Survey on Domestic-Overseas Price Difference of Telecommunication Service”
- International comparison of fixed telephone charges based on individual charges (fiscal 2022)
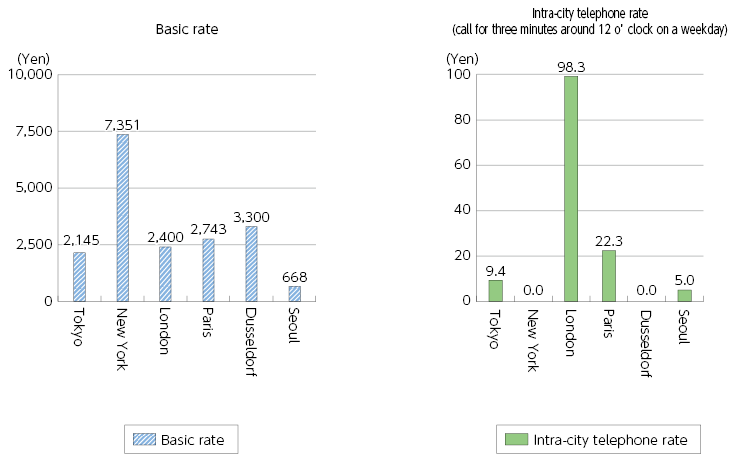
(Source) MIC “FY2022 Survey on Domestic-Overseas Price Difference of Telecommunication Service”
- Changes in communication frequency (by calling terminal)
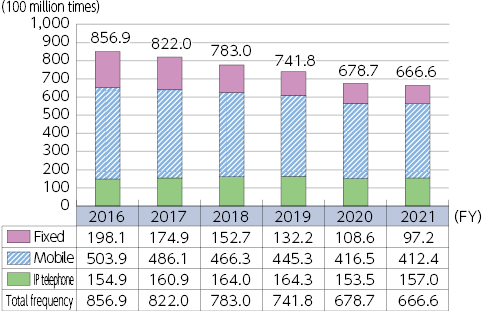
*Mobile communication: from mobile phone/PHS; Fixed communication: from subscribed telephone, ISDN and public telephone
- Changes in communication time (by calling terminal)
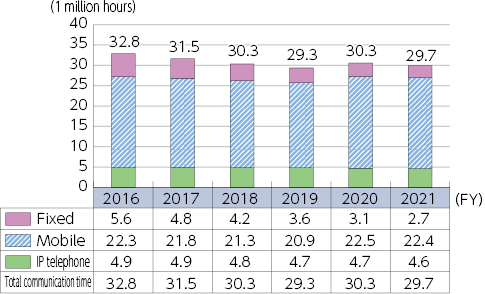
*1 Mobile communication: from mobile phone/PHS; Fixed communication: from subscribed telephone, ISDN and public telephone
*2 Unit is changed from “million hours” to “100 million hours” and values are rounded to the first decimal place. See the source for the values before rounding.
- Changes in the number of serious accidents | (Figure 4-2-2-9 in White Paper)
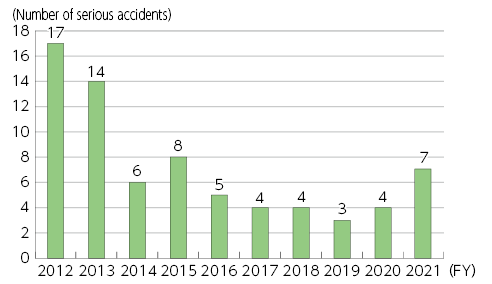
(Source) MIC “Accidents in Telecommunications Services (Fiscal 2021)”
- Changes in the number of complaints and inquiries received by MIC | (Figure 4-2-2-10 in White Paper)
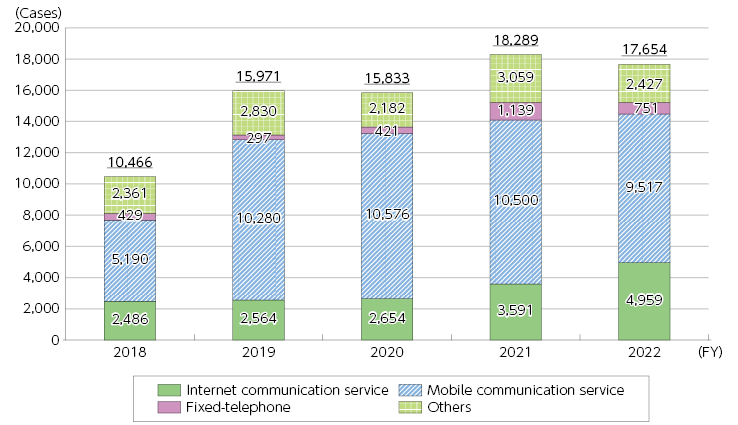
(Source) Created by MIC
- Breakdown of complaints and consultations received by consumer centers nationwide and the Ministry of Internal Affairs and Communications (random sample of those received between April 2022 and September 2022) | (Figure 4-2-2-11 in White Paper)
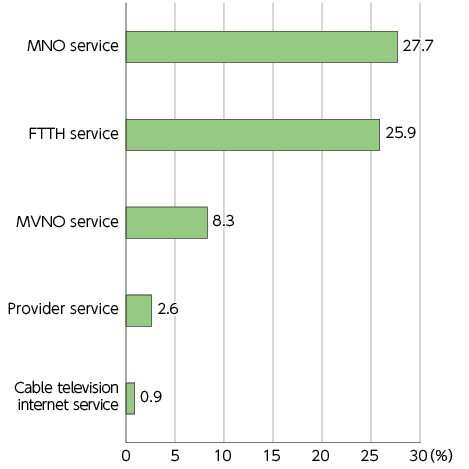
*There is a possibility that ISP services provided together with FTTH lines are only included in provider services.
(Source) MIC “Regular Meeting for Monitoring Consumer Protection Rules and ICT Service Reliability (14th meeting)”
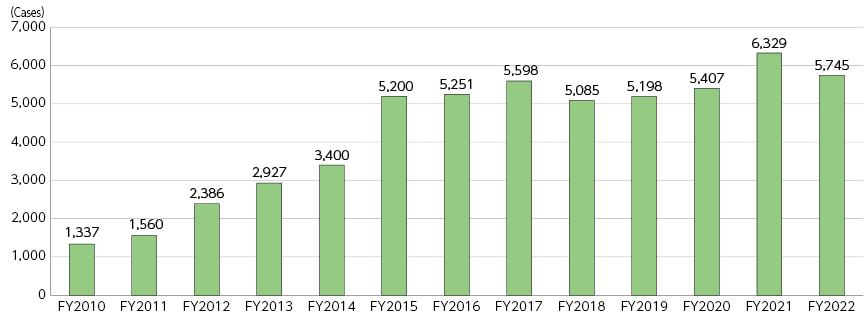
- Changes in the number of consultations regarding illegal and harmful information | (Figure 4-2-2-12 in White Paper)
- Breakdown of the number of consultations provided at the Illegal Harmful Hotline by business operator | (Figure 4-2-2-13 in White Paper)
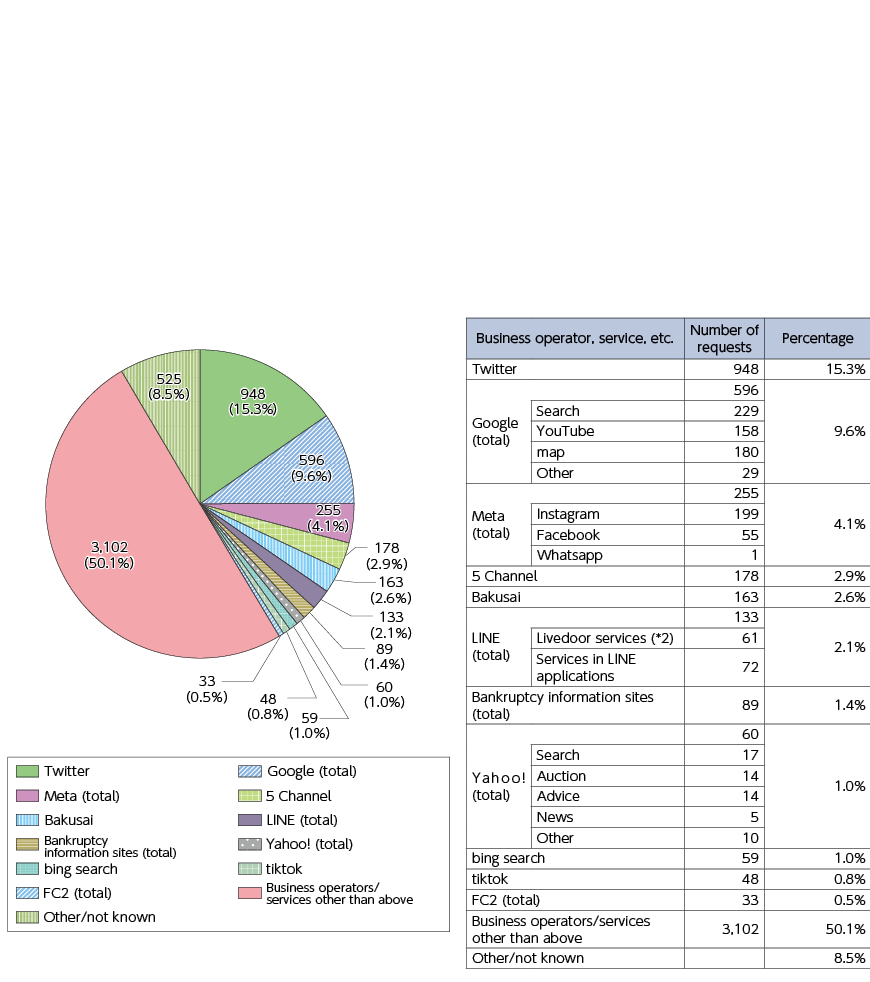
*1 Breakdown of the number of consultations (work): By business operator/service (n=6,189) <fiscal 2022> Number of consultations (work): 5,745 cases
*2 LINE sold the livedoor service on December 27, 2022, so responses from January 2023 are not included.
*3 Total number of consultations (work), and counseling centers do not determine whether or not individual consultations constitute a violation of rights.
*4 Since data is compiled by entering a representative domain for each work case, it is not strictly compiled statistical information because there are cases where an applicable domain covers multiple sites.
*5 Some use their own domains, so the actual domain may not be known.
- Status of IPv6 service provision (by ISP size) (January 2023)
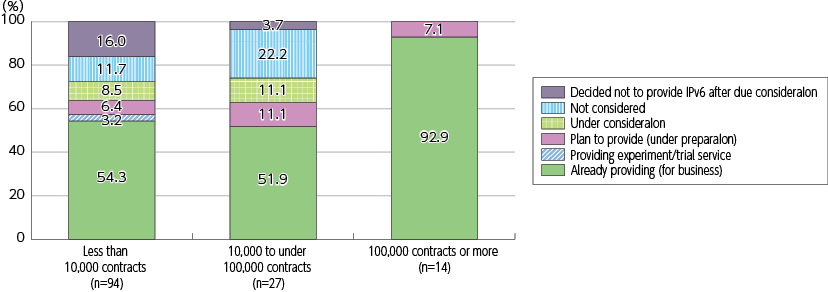
(Source) Prepared from MIC questionnaire survey
- Market revenue share of domestic client virtualization solutions (on-premises) by vendor sales (2021)
(Source) IDC ”Japan Virtual Client Computing Market Share” (July 6, 2022)
- Overview of optical data relay service | (Figure 4-2-3-1 in White Paper)
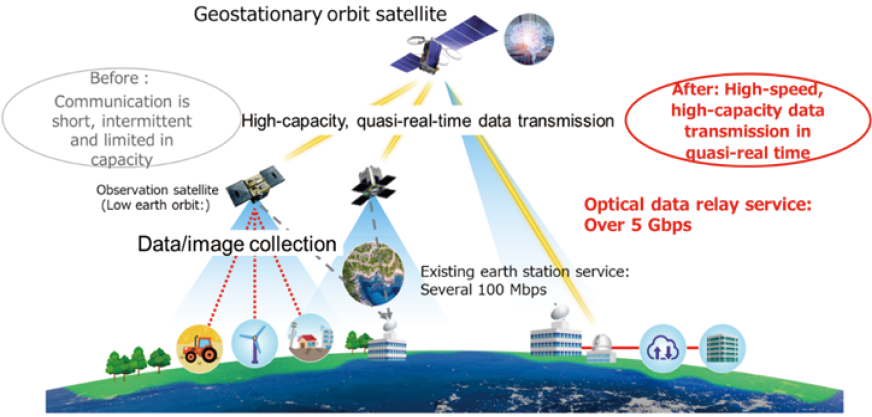
(Source) Nippon Telegraph and Telephone Corporation “NTT and SKY Perfect JSAT Corporation agree to establish Space Compass, Inc.”
Chapter 4 - Section 3
- Changes in the size of the broadcasting industry market (total sales) and market breakdown | (Figure 4-3-1-1 in White Paper)
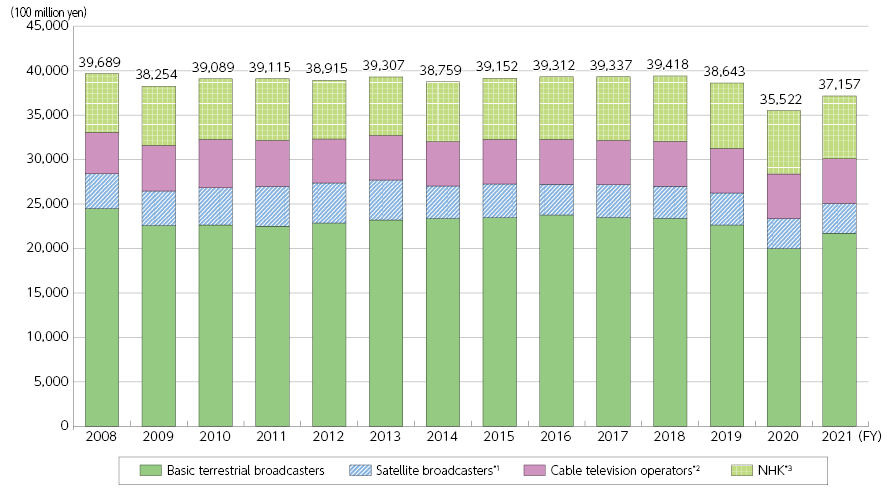
*1 Calculated based on operating revenues related to the satellite broadcasting business.
*2 Up to fiscal 2010, cable TV operators were commercial corporations that conducted independent broadcasting using facilities approved under the former Cable Television Broadcasting Act (including facilities registered under the former Broadcast Act for Use of Telecommunications Services that uses a broadcasting system equivalent to the facilities), and from fiscal 2011, cable television operators are registered general broadcasters (limited to commercial corporations) that conduct independent broadcasting using cable telecommunications equipment (with both excluding operators using the IP multicast method).
*3 NHK’s value is ordinary business income.
*4 Community broadcasters who are also engaged in cable television are excluded.
(Source) Prepared based on the MIC “Income and Expenditures of Private Broadcasters” and NHK “Financial Statements” for each fiscal year
- Ratio of broadcasting industry sales
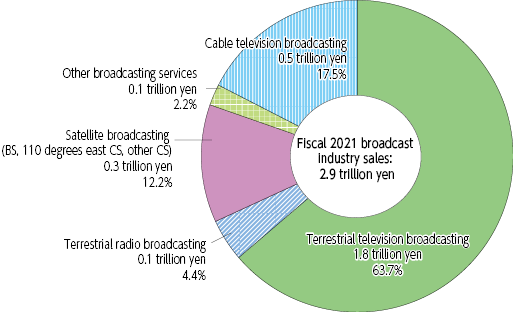
*Sales of “cable television broadcasting” include sales of basic services, paid services (paid channels, etc.), and poor reception rebroadcast services.
- Sales ratio of Internet incidental services business
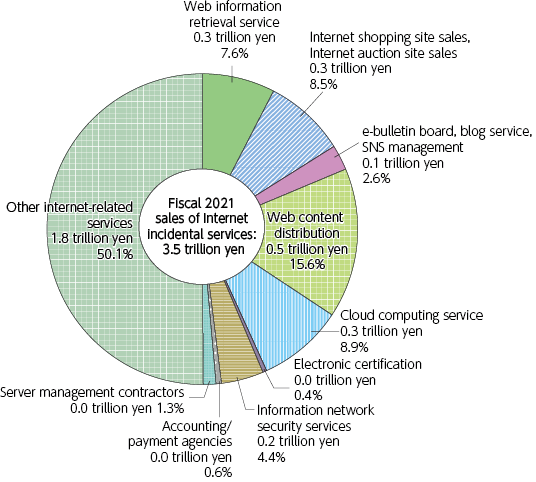
*“Web content streaming business” includes mobile streaming and IPTV services.
- Changes in advertising expenditures of terrestrial private broadcasters
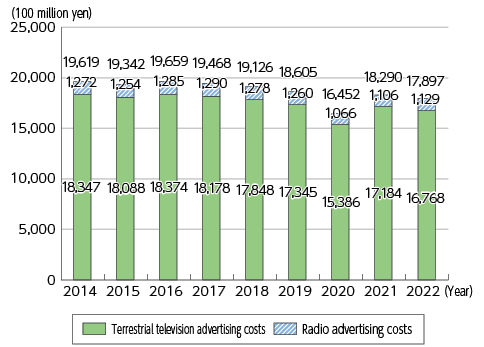
(Source) Prepared based on Dentsu's “Advertising Costs in Japan”
- Changes in operating profit on sales of private broadcasters | (Figure 4-3-1-2 in White Paper)
*Basic terrestrial broadcasting excluding community broadcasting
(Source) Prepared based on the MIC “Income and Expenditures of Private Broadcasters” for each fiscal year. etc.
- Changes in the number of private broadcasters | (Figure 4-3-1-3 in White Paper)
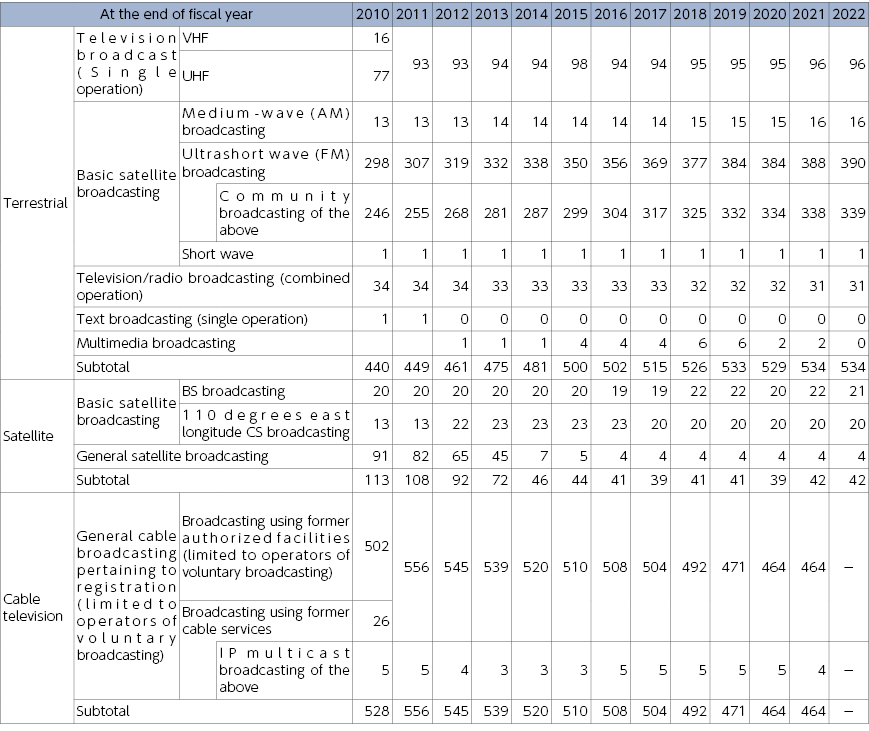
*1 The number of television broadcasters (single operation) at the end of fiscal 2015 included five operators (including one which also operates basic terrestrial broadcasting) conducting basic terrestrial broadcasting for mobile reception.
*2 Regarding satellite broadcasters, based on the amended Broadcast Act that came into force in June 2011, BS broadcasting and 110 degrees east longitude CS broadcasting are counted as basic satellite broadcasting while other satellite broadcasting is counted as general satellite broadcasting.
*3 Some satellite broadcasters operate two or more types of broadcasting (BS broadcasting, 110 degrees east longitude CS broadcasting, and general satellite broadcasting) so the totals of each column do not match the values in the subtotal column. Furthermore, from fiscal 2011, only operating broadcasters are included.
*4 Regarding cable television operators, up to fiscal 2010, former approved facilities operators under the former Cable Television Broadcasting Act and registered operators under the former Act on Broadcast on Telecommunications Services were included, and from fiscal 2011, registered general broadcasters conducting independent broadcasting using cable telecommunication facilities under the Broadcast Act are included (regarding IP multicast broadcasting, up to fiscal 2010, it is included in former broadcasting using cable services, and from fiscal 2011 it is included in registered general broadcasters conducting independent broadcasting using cable telecommunications equipment).
(Source) Prepared based on the MIC “Current State of Cable Television” (only the values for cable TV operators)
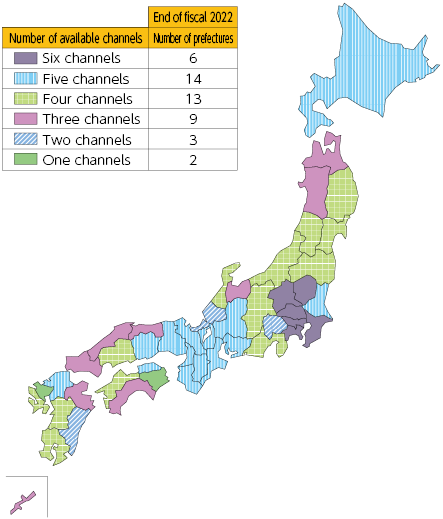
- Number of available private terrestrial television broadcasting channels (fiscal 2022)
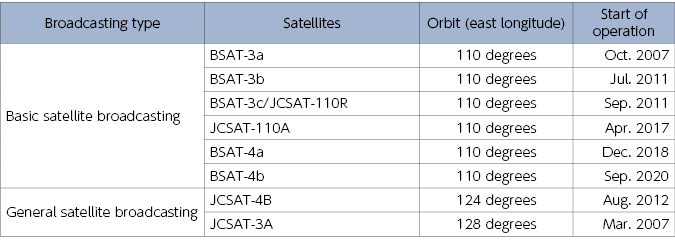
- Major satellites used for satellite broadcasting in Japan (at the end of fiscal 2022)
- Changes in the number of subscribed households and penetration rate for receiving services from cable telecommunications equipment that provide independent broadcasting as per their registration | (Figure 4-3-1-4 in White Paper)
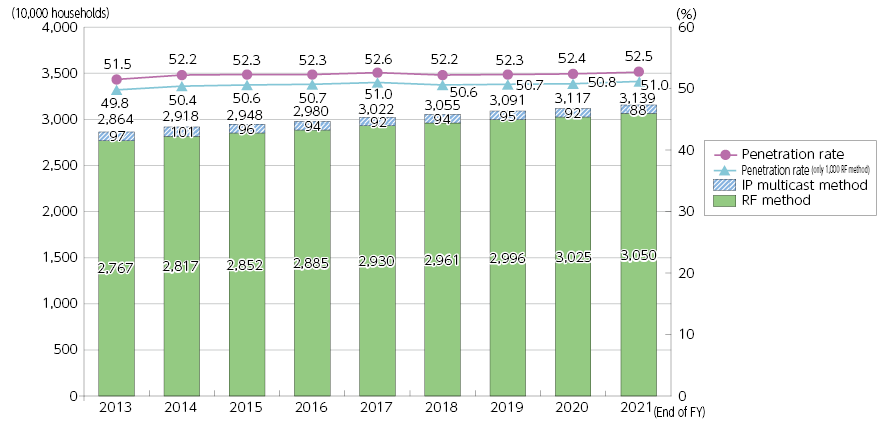
*1 The penetration rate is calculated from the number of households in the Basic Resident Register.
*2 The number of subscribed households with the RF method means the total number households (including the number of households with radio interference) connected to the cable telecommunications equipment as per their registration.
(Source) Prepared based on the MIC “Current State of Cable Television”
- NHK domestic broadcasting (end of fiscal 2022) | (Figure 4-3-1-5 in White Paper)
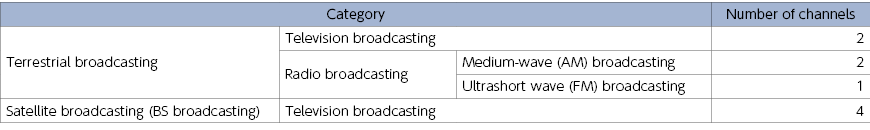
*1 The radio broadcasting frequency is also indicated by the channel.
*2 With regard to television broadcasting, analog television broadcasting ended on March 31, 2021, and all broadcasting has been shifted to digital broadcasting.
- NHK’s international television and radio broadcasting (plan as of April 2023) | (Figure 4-3-1-6 in White Paper)
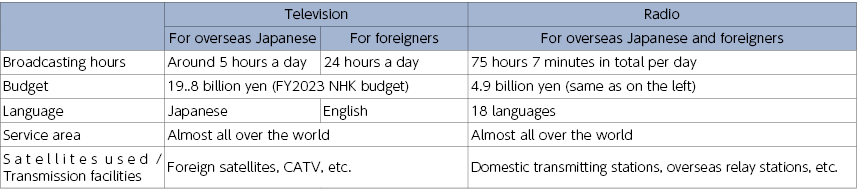
*The number of broadcasting hours of international TV broadcasting for foreigners includes the broadcasting hours of Japan International Broadcasting (JIB).
- Number of subscribers to broadcasting services | (Figure 4-3-1-7 in White Paper)
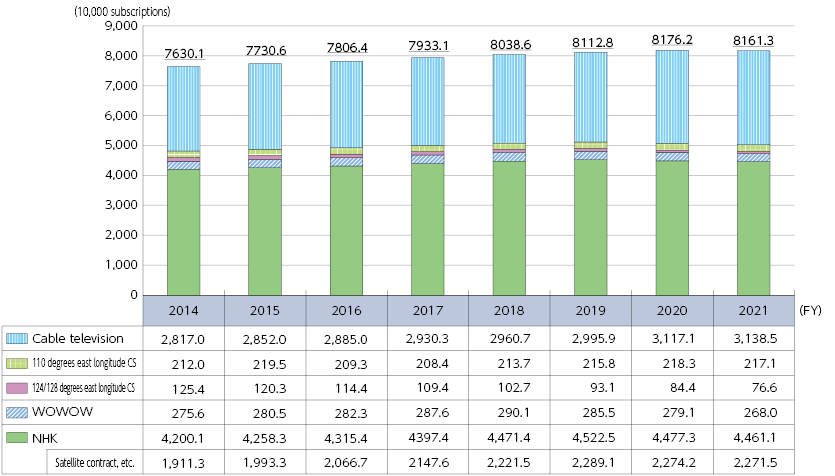
*1 The number of subscribers to terrestrial broadcasting (NHK) is the number of NHK subscriptions of all subscription types.
*2 The number of subscribers to satellite contracts, etc. is the number of NHK satellite contracts and special contracts.
*3 The number of WOWOW subscribers is the number of WOWOW subscriptions.
*4 The number of subscribers of 124/128 degrees east CS is the number of Sky Perfect! premium service subscriptions.
*5 The number of subscribers of 110 degrees east CS is the number of Sky Perfect! subscriptions.
*6 The number of households subscribed to cable television is the number of households subscribed to cable telecommunications equipment that carry out independent broadcasting as per their registration.
(Source) Prepared based on material from the Japan Electronics and Information Technology Industries Association, Japan Cable Laboratories, and NHK, and the MIC “Current State of Satellite Broadcasting” and “Current State of Cable Television”
- Changes in the number of NHK broadcast subscriptions | (Figure 4-3-1-8 in White Paper)
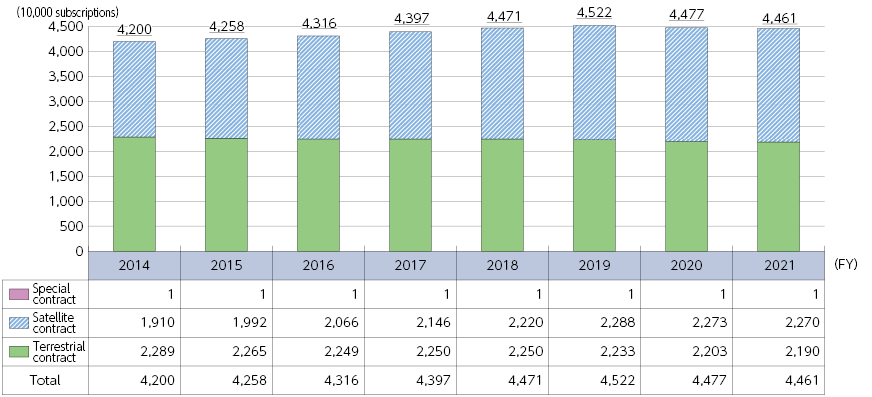
(Source) Prepared based on material from NHK
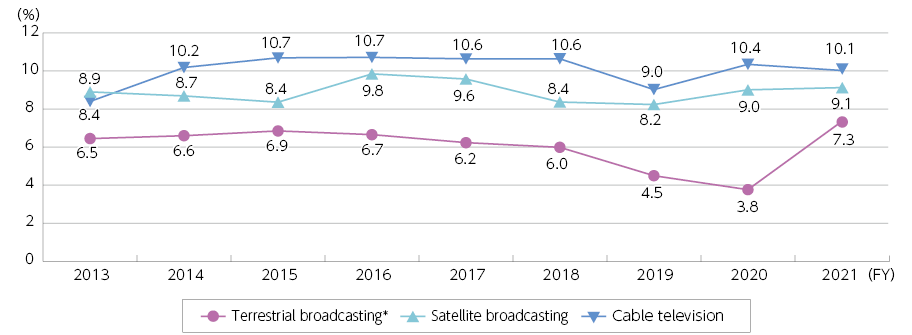
- Changes in the number of serious accidents | (Figure 4-3-1-9 in White Paper)
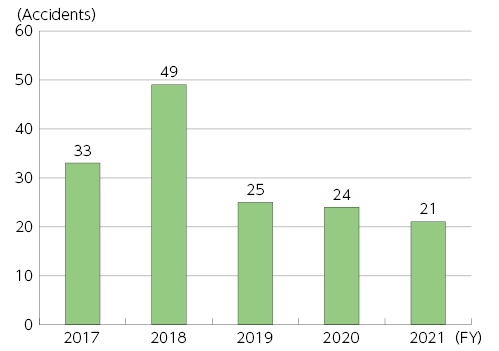
(Source) Prepared based on the MIC “State of the Occurrence of Broadcasting Suspension Accidents” (fiscal 2021)
- Changes in the number of broadcasting suspension accidents by cause | (Figure 4-3-1-10 in White Paper)
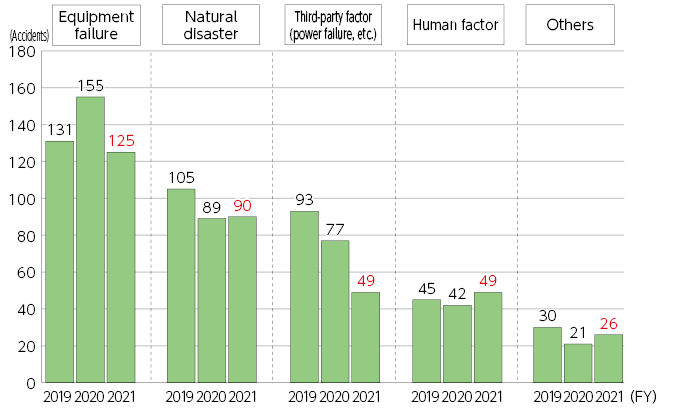
(Source) Prepared based on the MIC “State of the Occurrence of Broadcasting Suspension Accidents (fiscal 2021)”
- Breakdown of the Japanese content market (2021) | (Figure 4-3-2-1 in White Paper)
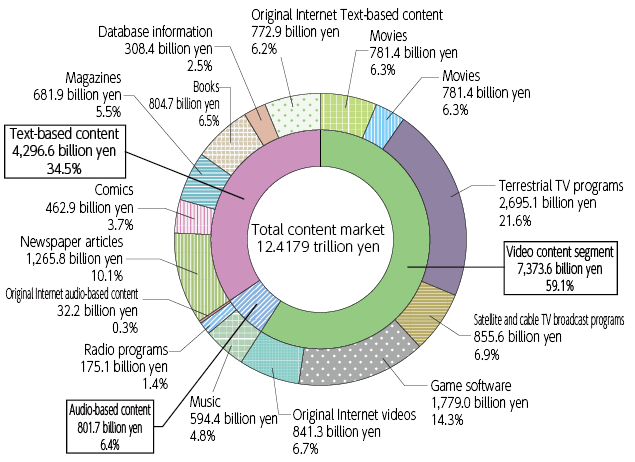
(Source) MIC Institute for Information and Communications Policy “Survey on Media/Software Production and Distribution”
- Changes in size of the Japanese content market (by content type) | (Figure 4-3-2-2 in White Paper)
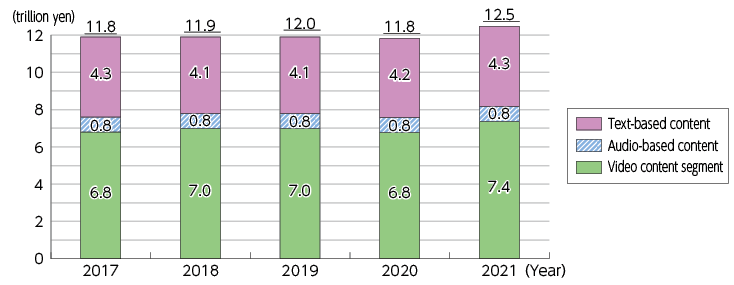
(Source) MIC Institute for Information and Communications Policy “Survey on Media/Software Production and Distribution”
- Breakdown of primary distribution market (2021) | (Figure 4-3-2-3 in White Paper)
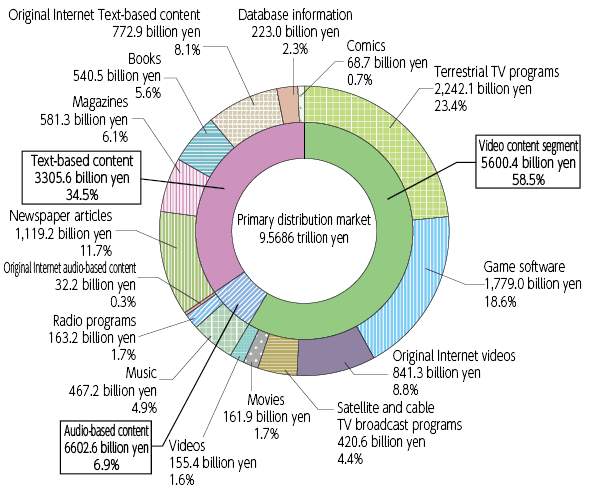
(Source) MIC Institute for Information and Communications Policy “Survey on Media/Software Production and Distribution”
- Breakdown of multi-use market (2021) | (Figure 4-3-2-4 in White Paper)
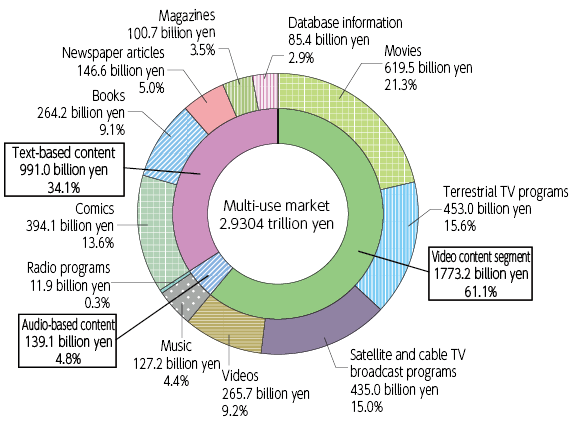
(Source) MIC Institute for Information and Communications Policy “Survey on Media/Software Production and Distribution”
- Breakdown of the communication content market (2021) | (Figure 4-3-2-5 in White Paper)
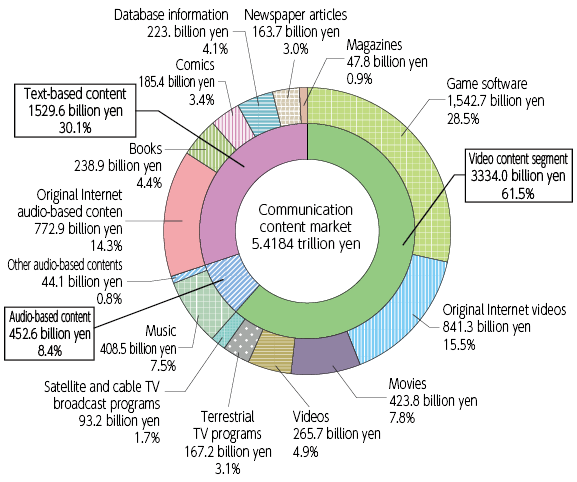
(Source) MIC Institute for Information and Communications Policy “Survey on Media/Software Production and Distribution”
- Changes in the size of the telecommunications content market (by content type) | (Figure 4-3-2-6 in White Paper)
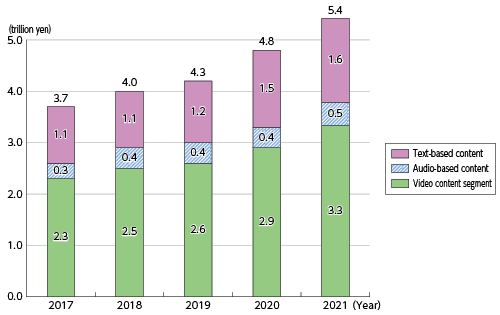
(Source) MIC Institute for Information and Communications Policy “Survey on Media/Software Production and Distribution”
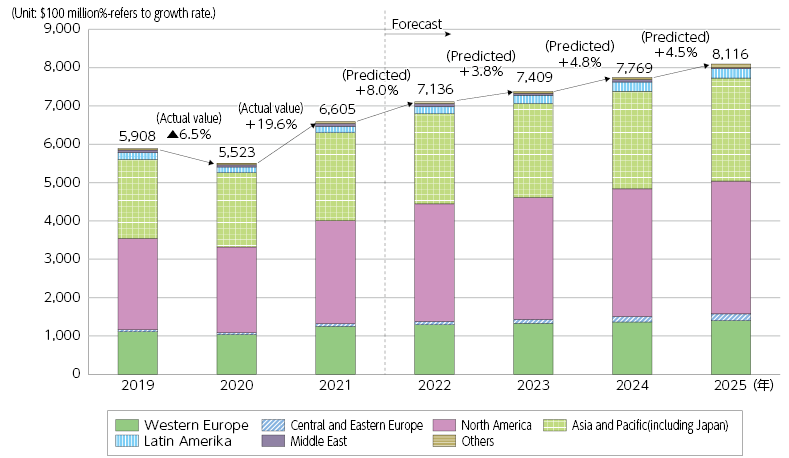
- Changes and forecast in global advertising expenditures by media type | (Figure 4-3-2-7 in White Paper)
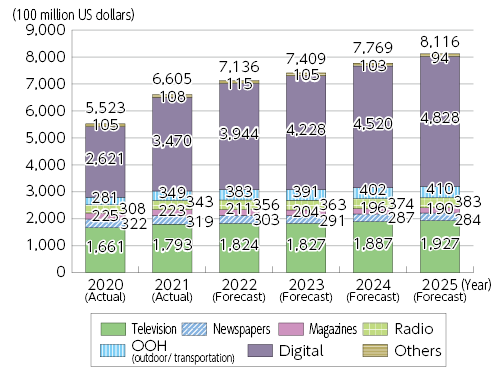
(Source) Prepared based on Dentsu Group's “Global Advertisement Spend Growth Rate Forecast (2022 to 2025)”
- Changes in advertising expenditure by media in Japan | (Figure 4-3-2-8 in White Paper)
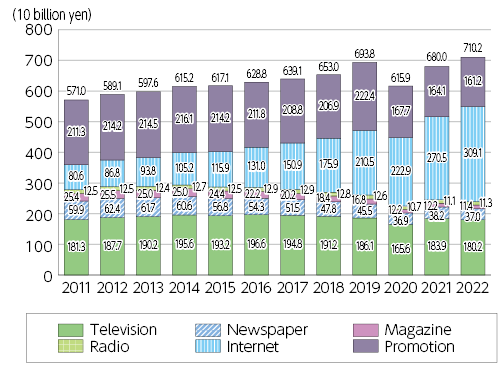
(Source) Prepared based on Dentsu’s “Advertising expenditure in Japan (each year)”
- Changes in global total advertising expenditure
(Source) Dentsu Group “Global Advertisement Spend Growth Rate Forecast (2022 to 2025)”
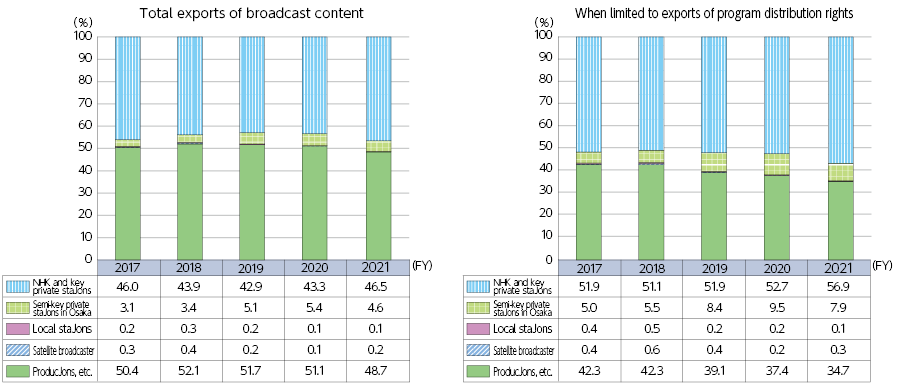
- Changes in the value of broadcasting content exports from Japan | (Figure 4-3-2-9 in White Paper)
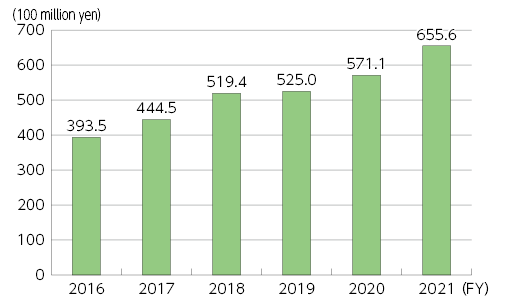
*1 Value of broadcasting content exports: Total sales to overseas of program broadcasting rights, Internet distribution rights, video/DVD rights, program format remake rights, and merchandising rights, etc.
*2 Calculated based on questionnaire responses submitted by NHK, key private broadcasting stations, semi-key private broadcasting stations, local stations, satellite broadcasters, CATV operators, and production companies, etc.
(Source) Prepared based on the MIC “Analysis of the Current Status of Overseas Expansion of Broadcasting Content”
- Changes in the value of Japan's broadcasting content exports by rights
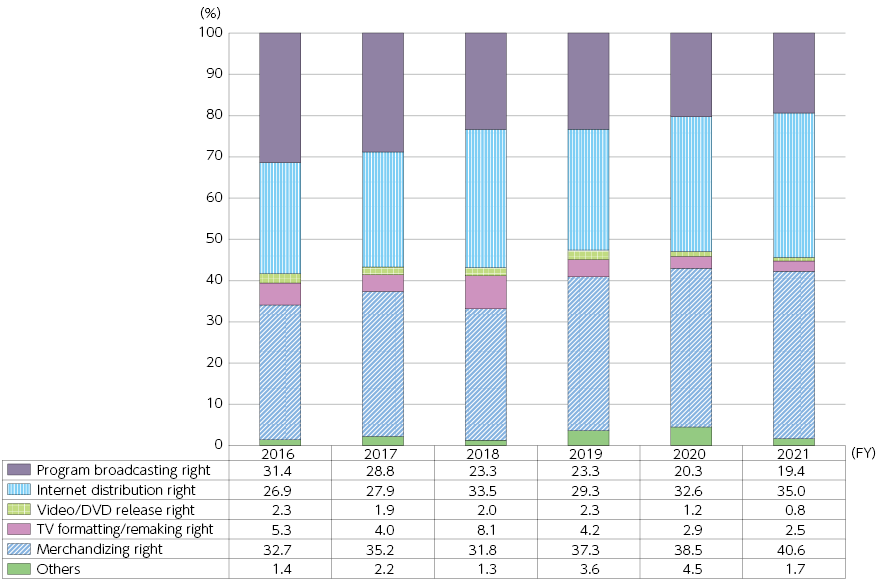
(Source) Prepared based on the MIC “Analysis of the Current Status of Overseas Expansion of Broadcasting Content”
- Changes in the value of Japan's broadcasting content exports by entity
(Source) Prepared based on the MIC “Analysis of the Current Status of Overseas Expansion of Broadcasting Content”
Chapter 4 - Section 4
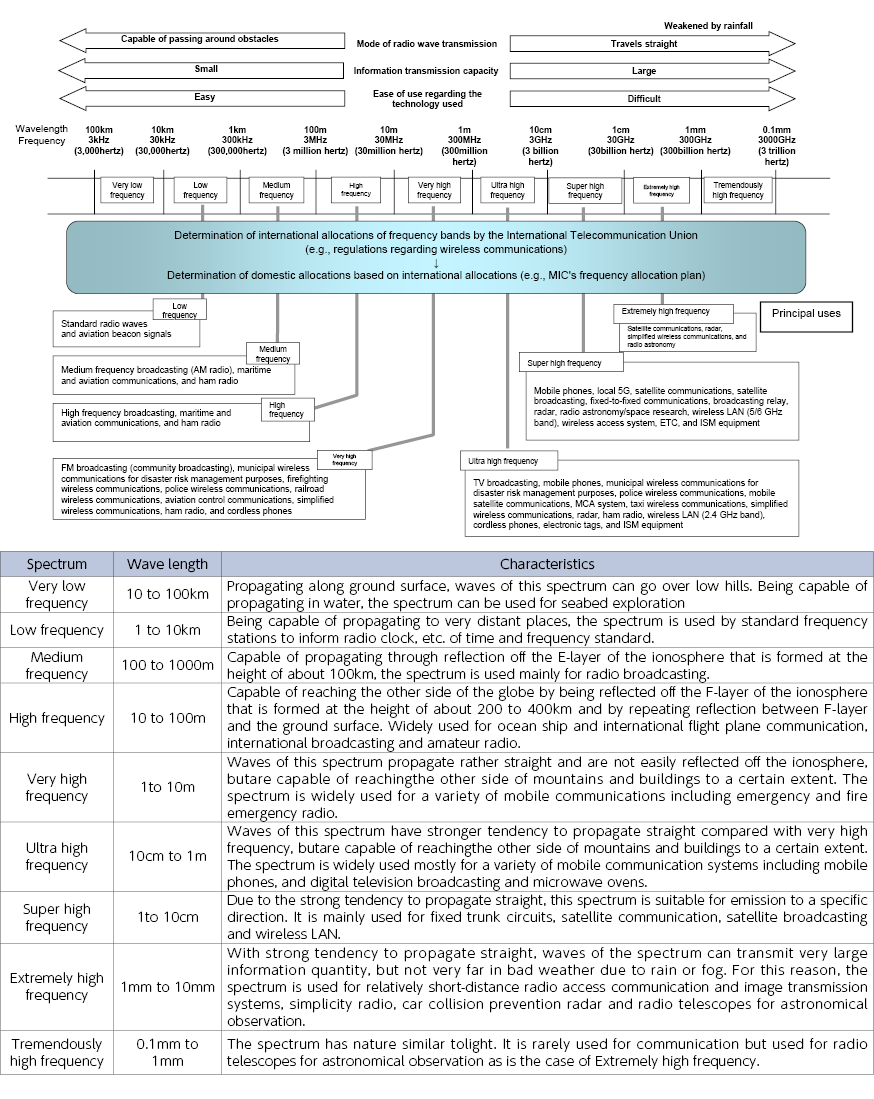
- Main uses and characteristics of each frequency band in Japan | (Figure 4-4-1-1 in White Paper)
- Changes in the number of radio stations | (Figure 4-4-2-1 in White Paper)
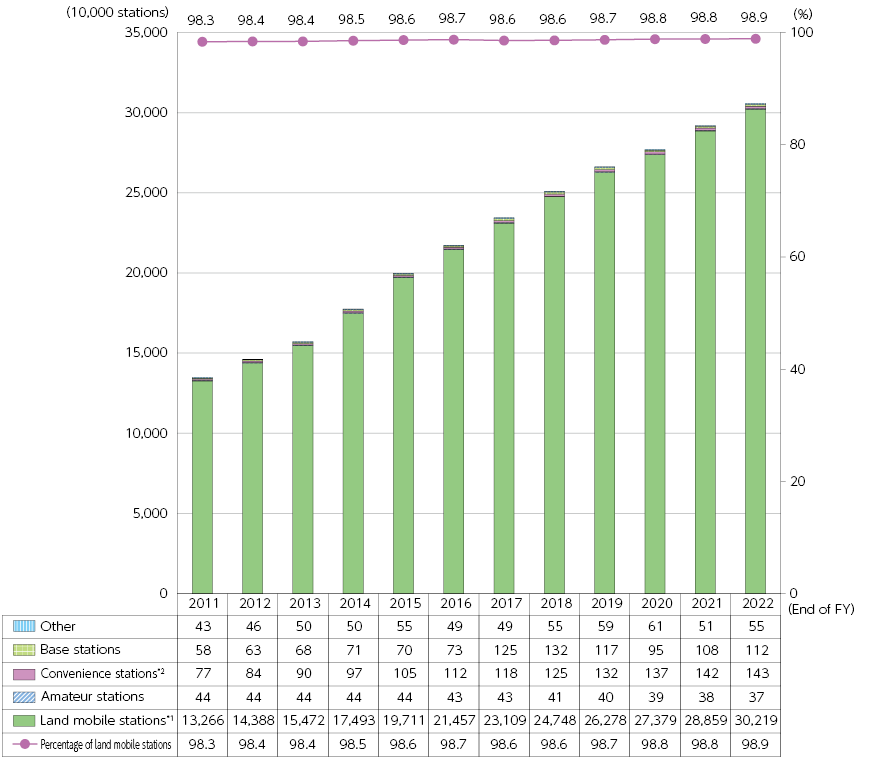
*1 Land mobile station: A radio station (such as a mobile phone devices) operated while moving on land or stopped at an unspecified point.
*2 Convenience radio station: A radio station that performs simple radio communication.
- Major geostationary satellites used for communications services in Japan (at the end of fiscal 2022)
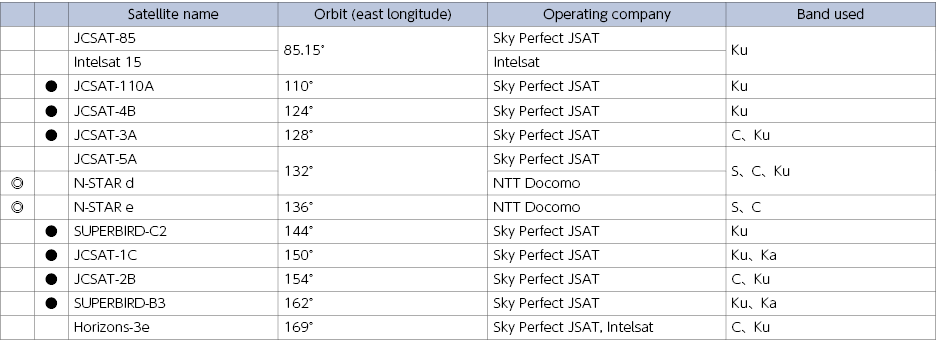
*1 Satellites with ¤ are mainly used for mobile communications. Satellites with l are also used for broadcasting.
*2 JCSAT-85 and Intelsat 15 are the name of the same satellite. Similarly, JCSAT-5A and N-STAR d are the name of the same satellite.
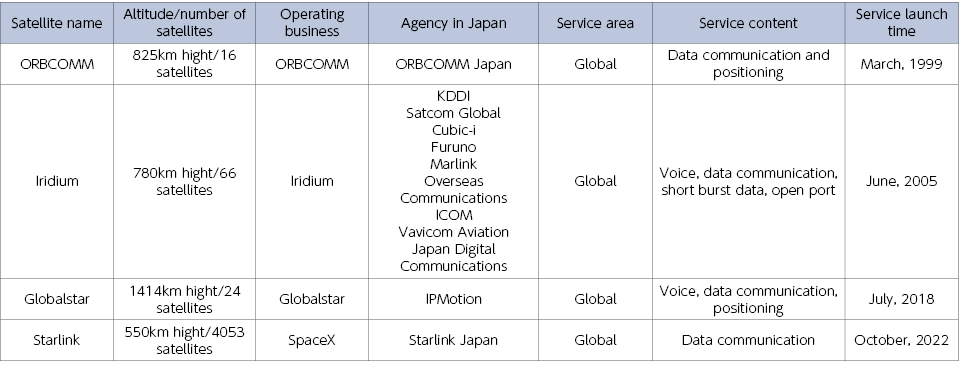
- Major non-geostationary satellites used for communications services in Japan (at the end of fiscal 2022)
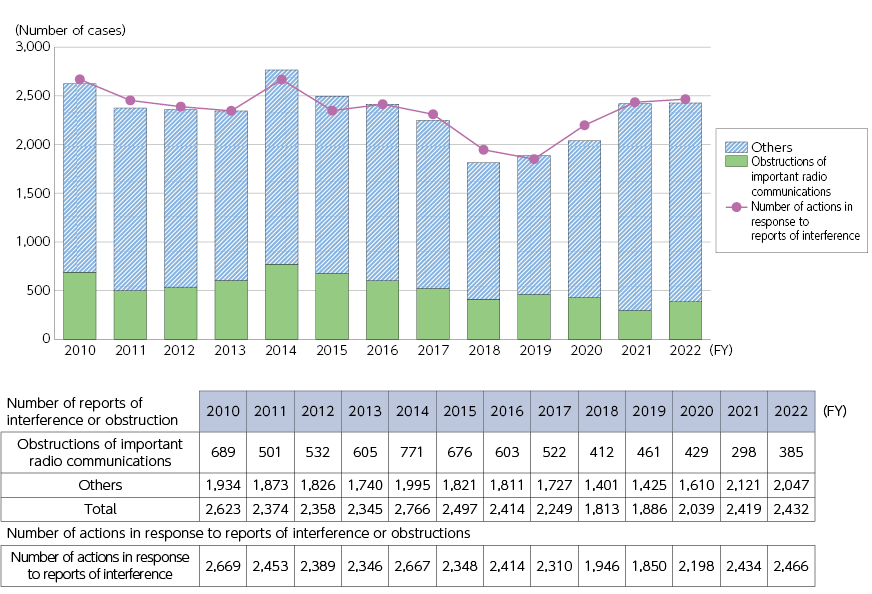
- Changes in the number of reports of jamming and obstruction of radio stations and the number of actions taken | (Figure 4-4-4-1 in White Paper)
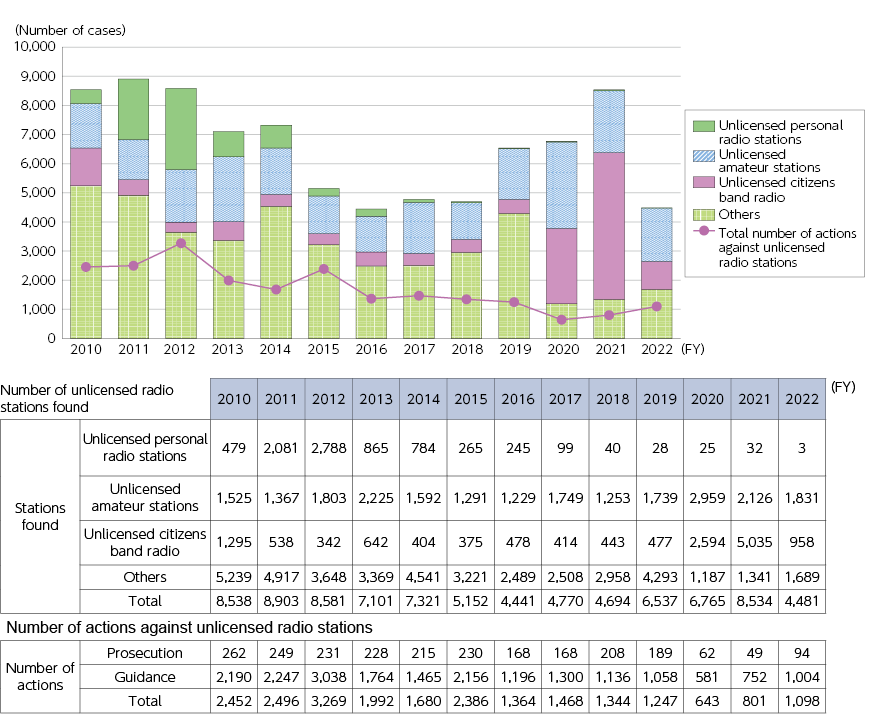
- Changes in the number of reports of unlicensed radio stations and the number of actions taken | (Figure 4-4-4-2 in White Paper)
Chapter 4 - Section 5
- Changes in the value of global network equipment shipments | (Figure 4-5-1-1 in White Paper)
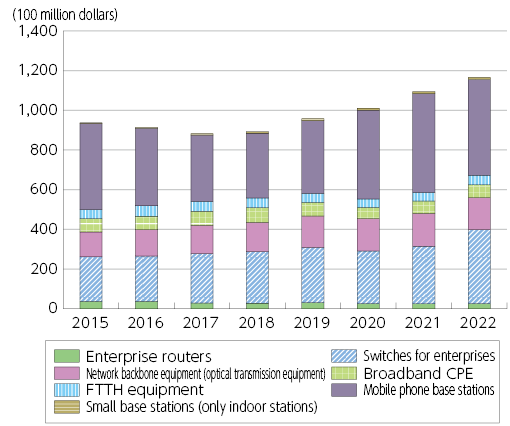
(Source) Omdia
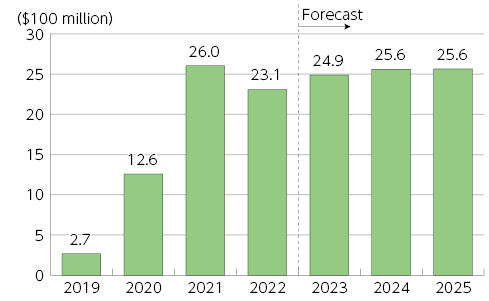
- Global 5G base stations (macrocells) market size (value of shipments)
(Source) Omdia
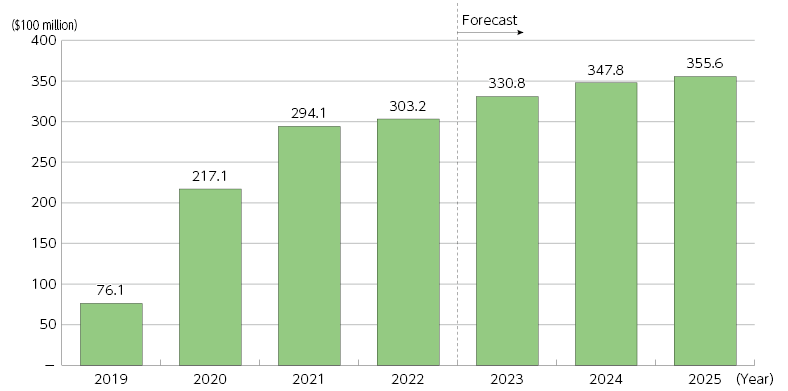
- Size (value of shipments) of the Japanese 5G base stations (macrocells) market | (Figure 4-5-1-2 in White Paper)
(Source) Omdia
- Global 5G base stations (macrocells) market share (value of shipments)
(Source) Omdia
- Share of global electronic components market (in terms of sales) (2021) | (Figure 4-5-1-3 in White Paper)
(Source) Omdia
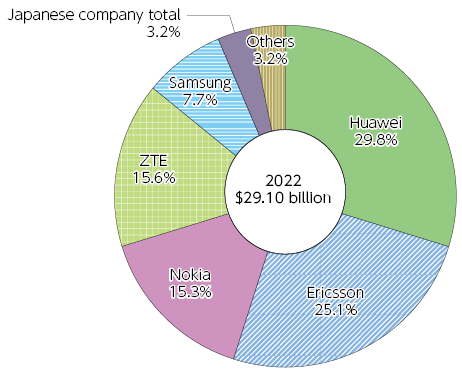
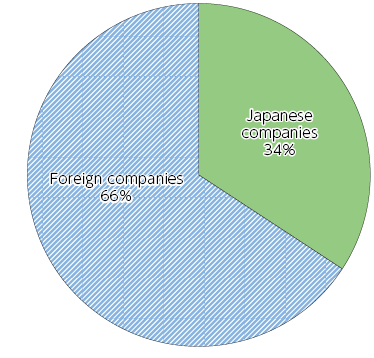
- Share of the global macrocell base station market (value of shipments in 2022) | (Figure 4-5-1-4 in White Paper)
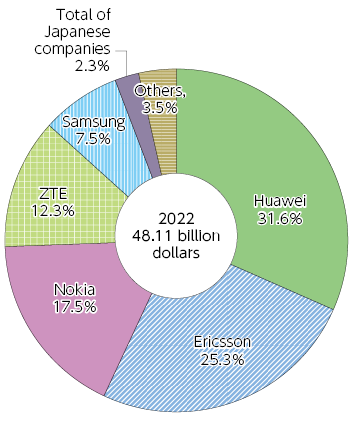
(Source) Omdia
- Global enterprise router market share
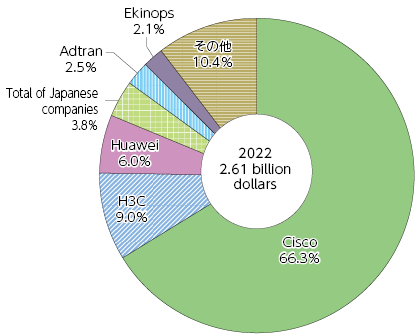
(Source) Omdia
- Japanese enterprise router market share
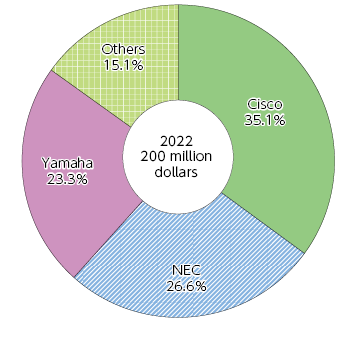
(Source) Omdia
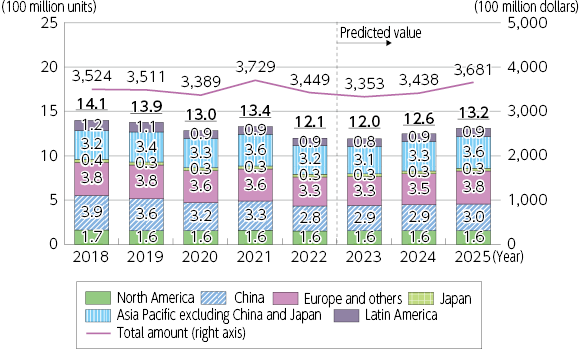
- Changes in the value of global information device shipments | (Figure 4-5-2-1 in White Paper)
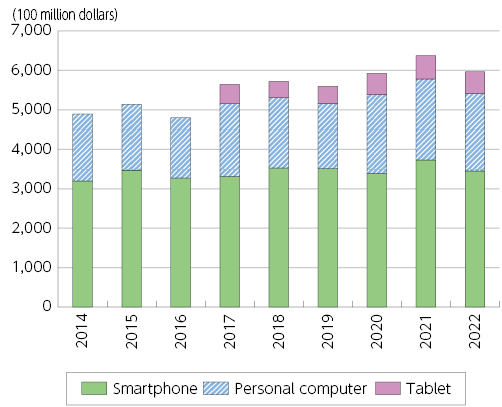
*Tablets have been counted since 2017
(Source) Omdia
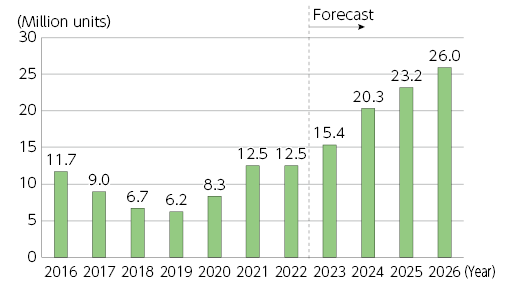
- Transition and Forecast of Global Shipment Volume of Smartphones & 5G Smartphones | (Figure 4-5-2-2 in White Paper)
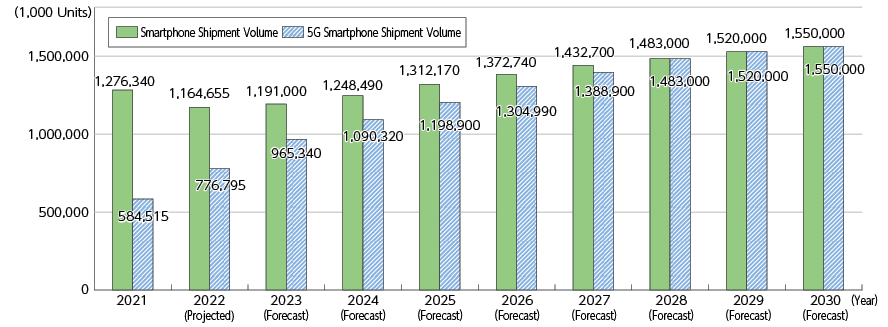
*1 Based on the shipment volume at manufacturers.
*2 The values for 2022 are those projected, and the values after 2023 are those forecasted.
*3 Number of 5G smartphones are included in the number of smartphones.
(Source) Yano Research Institute Ltd., “Global Market of Mobile Phone Subscriptions and Shipment Volume: Key Research Findings 2022” , February 7, 2023
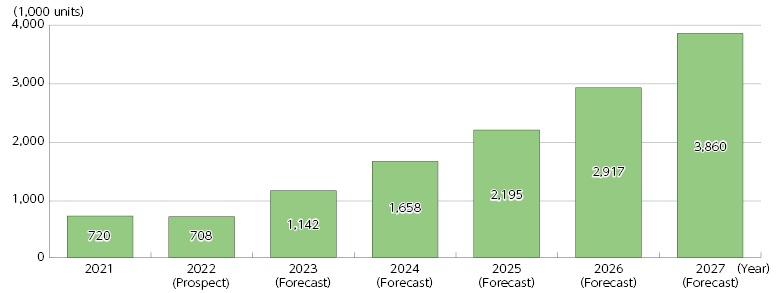
- Shipments of 5G smartphones in Japan | (Figure 4-5-2-3 in White Paper)
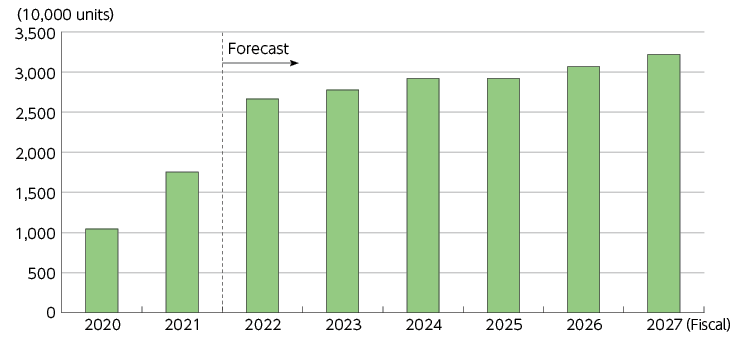
(Source) CIAJ “Medium-Term Demand Forecast for Communications Devices [Fiscal 2022 to Fiscal 2027]”
- Value of global shipments of 4K and 8K televisions | (Figure 4-5-2-4 in White Paper)
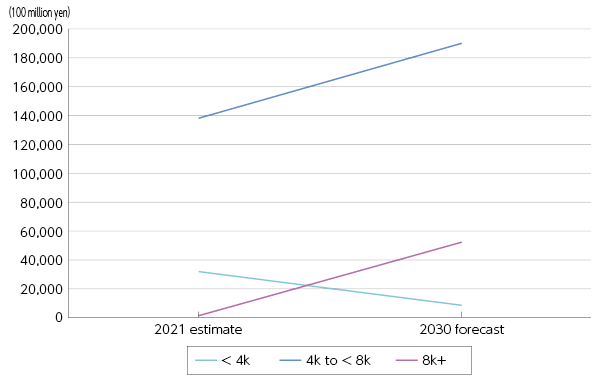
(Source) Fuji Chimera Research Institute, Inc. “5G/8K business future outlook survey 2022”
- Number of 4K and 8K televisions shipped in Japan | (Figure 4-5-2-5 in White Paper)
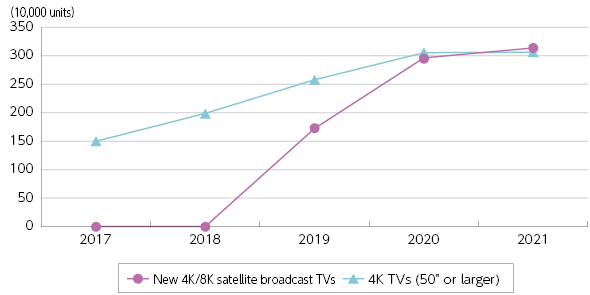
(Source) JEITA “Domestic Shipments of Consumer Electronic Devices”
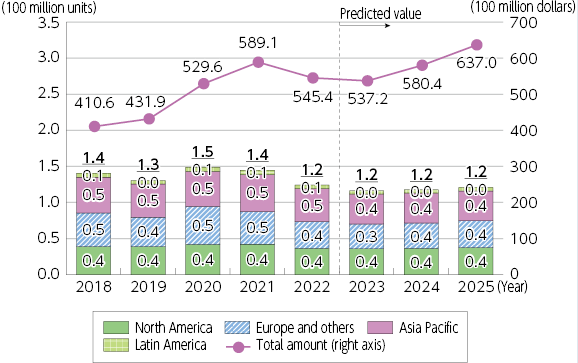
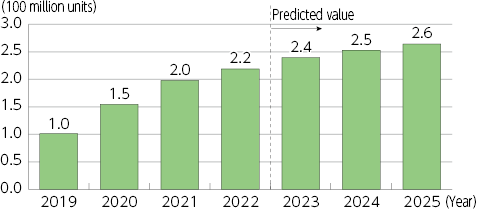
- Changes and forecast in global VR headset shipments | (Figure 4-5-2-6 in White Paper)
(Source) Omdia
- Forecast on Domestic Shipment Volume of HMDs for XR (VR/AR/MR) & 360-Degree Videos | (Figure 4-5-2-7 in White Paper)
*1 In terms of the number of units shipped by manufacturers.
*2 The value for 2022 is an estimate, and the values for 2023 and later are forecasts.
(Source) Yano Research Institute Ltd., “The Market of HMDs (Head Mounted Displays) for XR (VR/AR/MR) and 360-Degree Videos: Key Research Findings 2021” , May 11, 2022
- Changes in the value of the export surplus of ICT equipment and devices by country | (Figure 4-5-3-1 in White Paper)
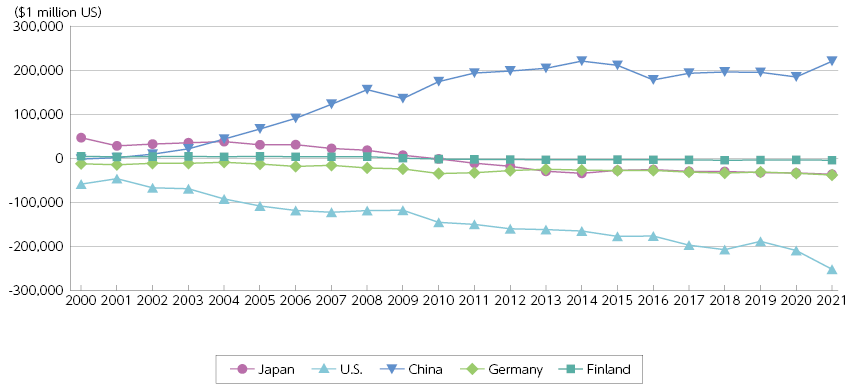
(Source) UNCTAD “UNCTAD STAT”
- Changes in the value of exports of ICT equipment and devices by country
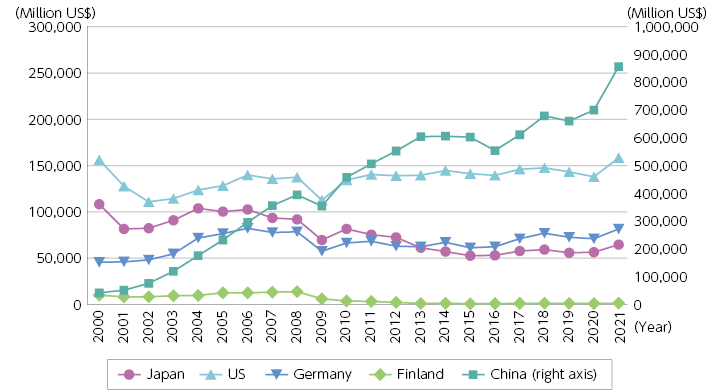
(Source) UNCTAD “UNCTAD STAT”
- Changes in the value of imports of ICT equipment and devices by country
(Source) UNCTAD “UNCTAD STAT”
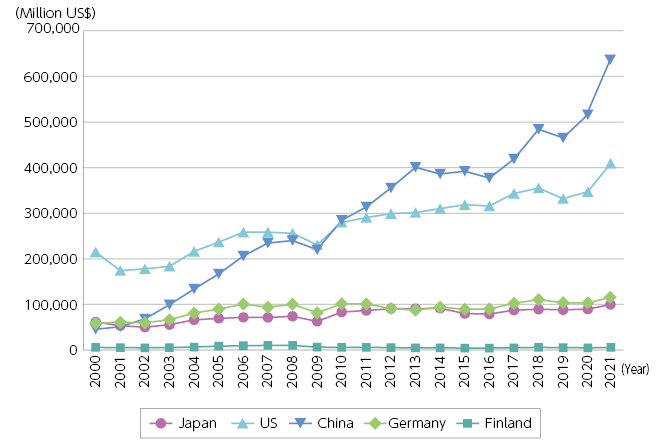
- Changes in global semiconductor market (value of shipments)
(Source) Omdia
- Changes in Global imaging sensor market share (value of shipments in 2022)
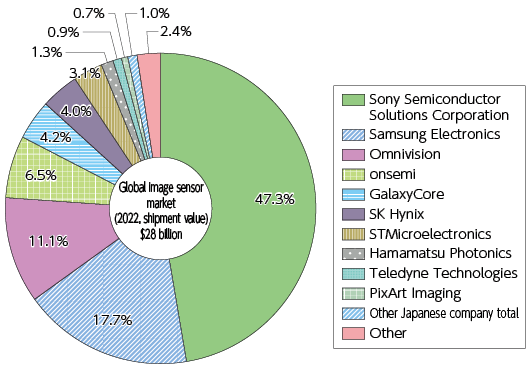
(Source) Omdia
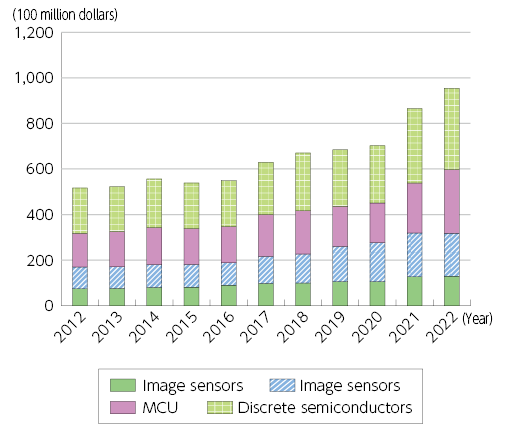
- Changes in Japan's semiconductor market (value of shipments)
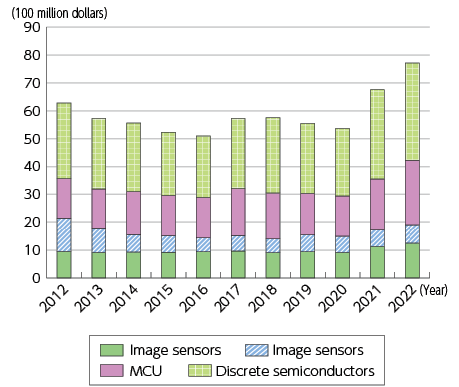
(Source) Omdia
- Changes in the global smartphone market share
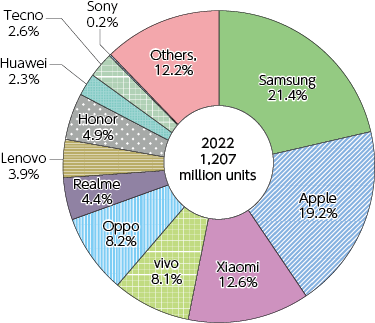
(Source) Omdia
- Changes in the global semiconductor market share
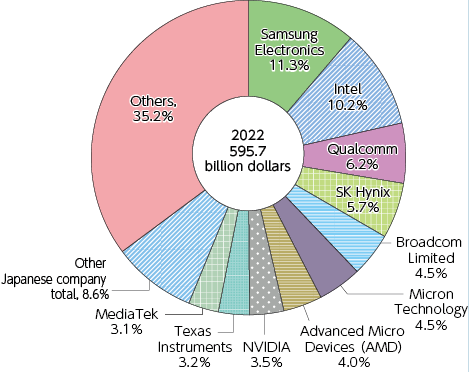
(Source) Omdia
- Japanese smartphone market share
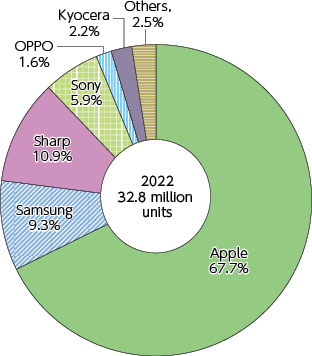
(Source) Omdia
- Japanese semiconductor market share
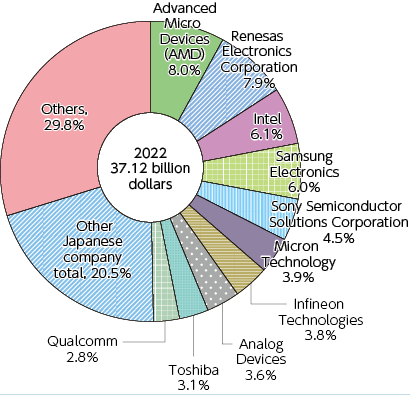
(Source) Omdia
- Changes and forecasts for the size of the global router/switch market (by category)
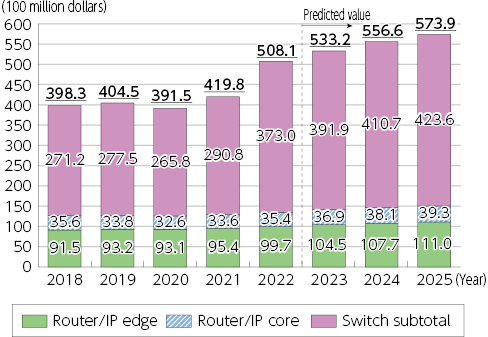
(Source) Omdia
- Changes and forecasts for the size of the global router/switch market (by region)
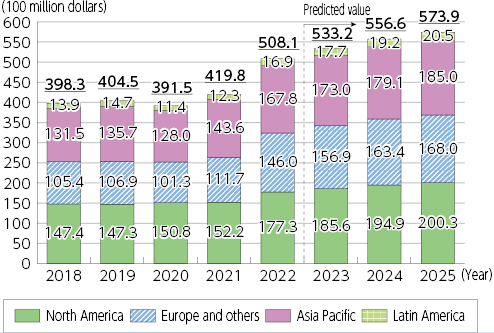
(Source) Omdia
- Changes and forecasts for the size of the global optical transmission equipment market
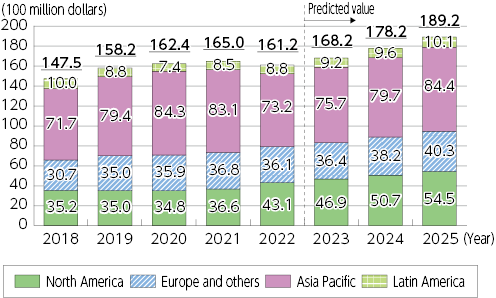
(Source) Omdia
- Changes and forecasts for the size of the global FTTH equipment market
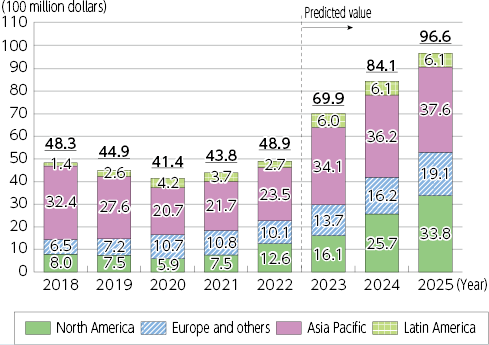
(Source) Omdia
- Changes and forecasts for the size of the global macrocell base station market
(Source) Omdia
- Changes and forecasts for the size of the global indoor small cell market
(Source) Omdia
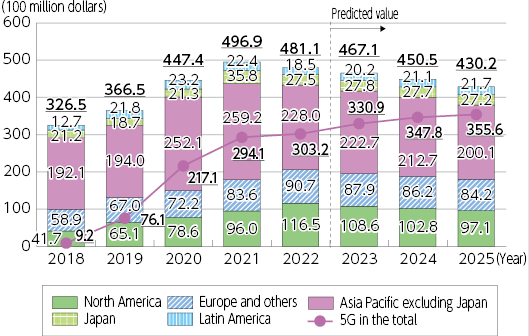
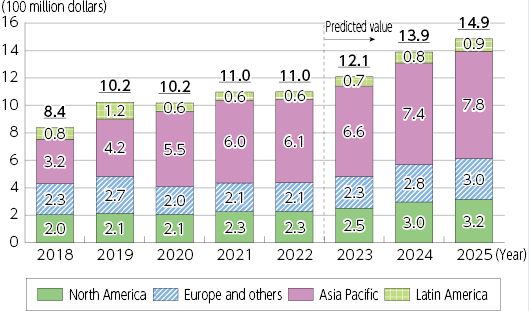
- Changes and forecasts for the number of global shipments of IC for LPWA module
(Source) Omdia
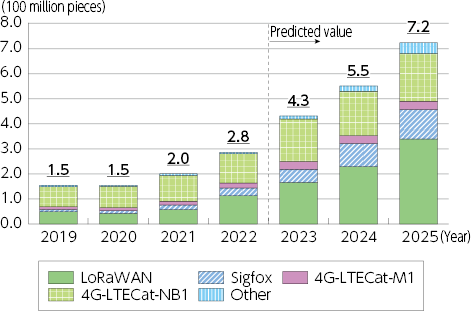
- Changes and forecasts for the number of global LPWA connection lines
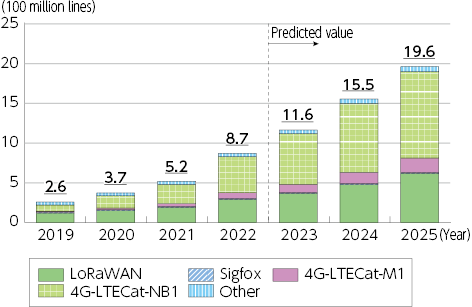
(Source) Omdia
- Changes and forecasts for the size of the global smartphone market and the number of shipments
(Source) Omdia
- Changes and forecasts for the size of the global tablet market and the number of shipments
(Source) Omdia
- Changes and forecasts for the size of the global wearable terminal market
(Source) Omdia
- Changes and forecasts for the size of the global domestic/consumer robot market and the number of shipments
(Source) Omdia
- Changes and forecasts for the number of global AI speaker (smart speaker) shipments
(Source) Omdia
- Changes and forecasts for the size of the global AR/VR market and the number of shipments
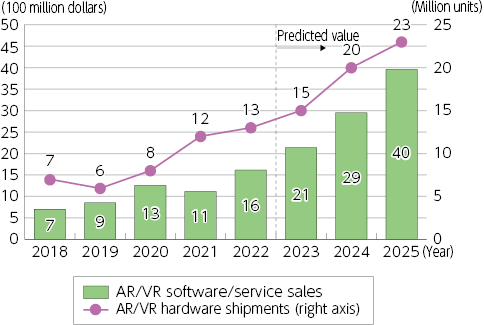
(Source) Omdia
- Changes and forecasts for the number of global IoT devices
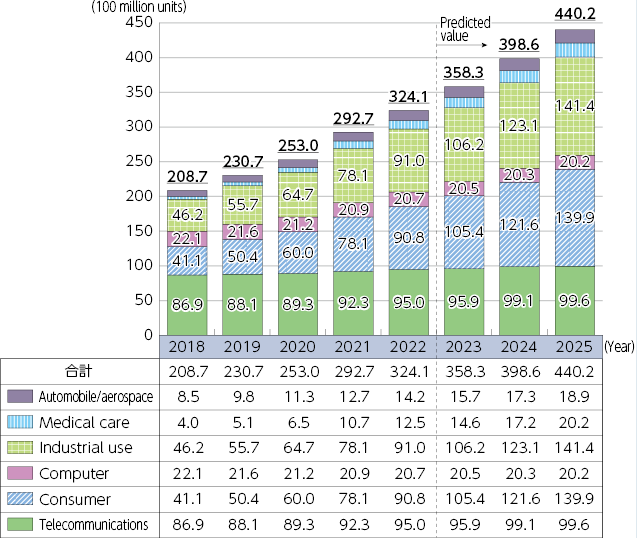
(Source) Omdia
- Global number and growth-rate forecasts for IoT devices by sector/industry
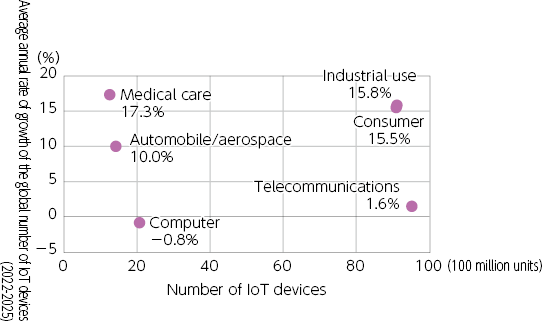
(Source) Omdia
Chapter 4 - Section 6
- Efforts by Japanese telecom operators to utilize and introduce satellites, etc. | (Figure 4-6-1-1 in White Paper)
*The figures for 2022 are as of January 14, 2022, and the figures for 2023 are as of March 31, 2023.
(Source) Acquired from Wright Investors' Service, Inc.
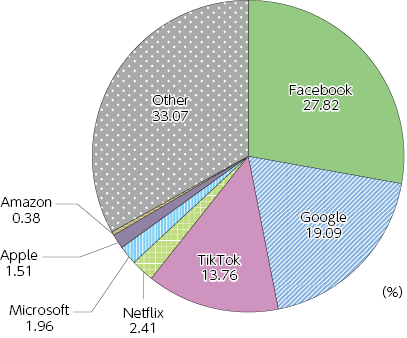
- Sales of platform providers in Japan, the U.S. and China | (Figure 4-6-1-2 in White Paper)
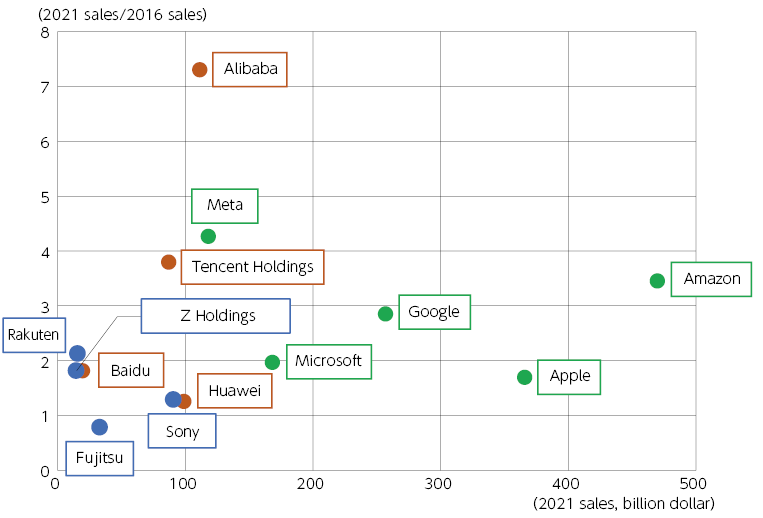
(Source) Prepared based on Statista data
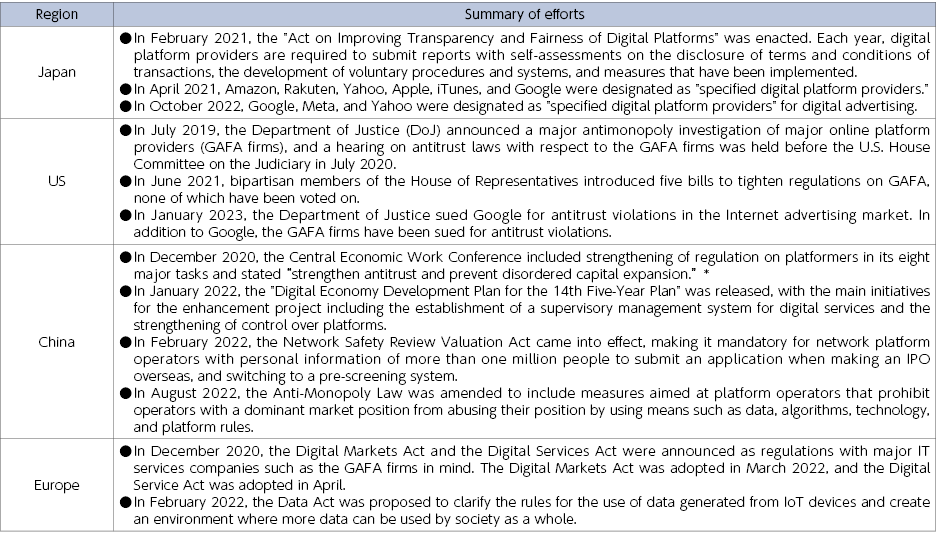
- Overseas regulation to ensure a competitive environment of the markets
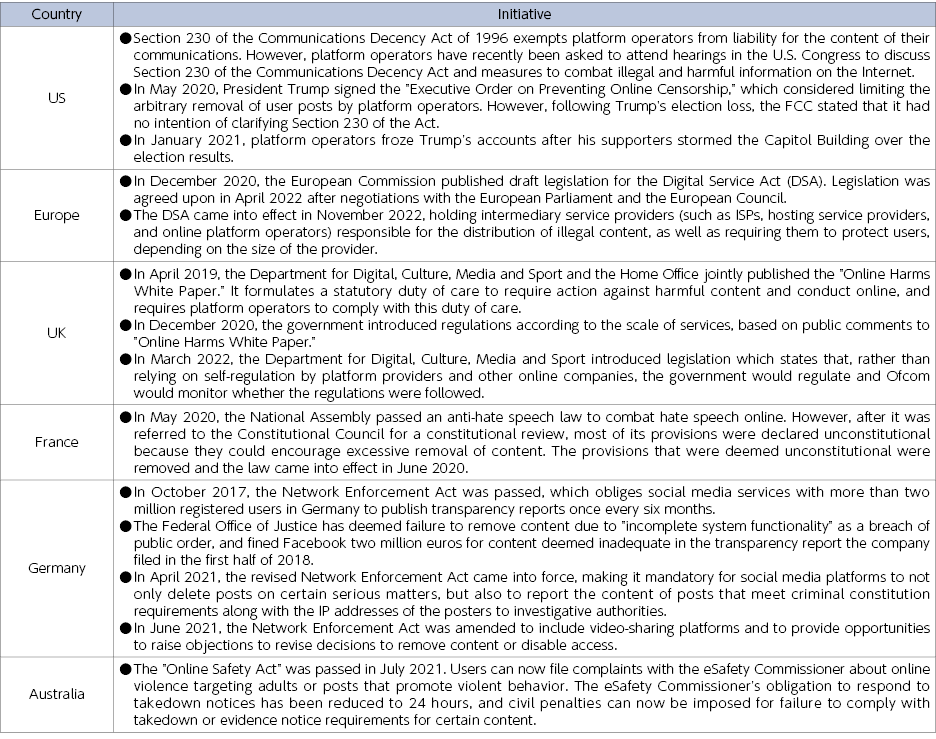
- Overseas regulation on illegal/harmful contents on the Internet
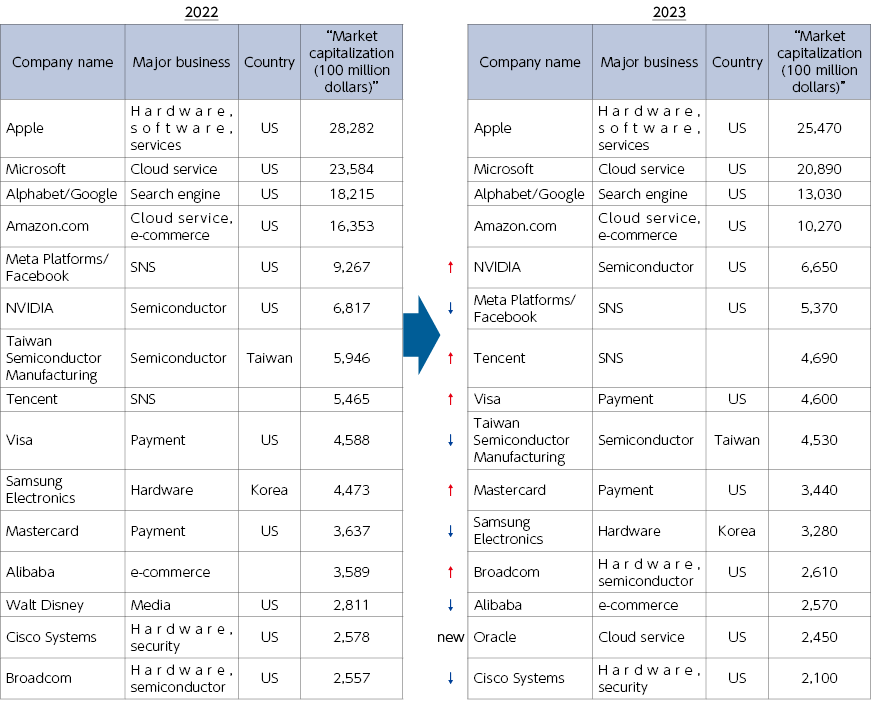
- Trends with major platform providers in the U.S. and China | (Figure 4-6-2-1 in White Paper)
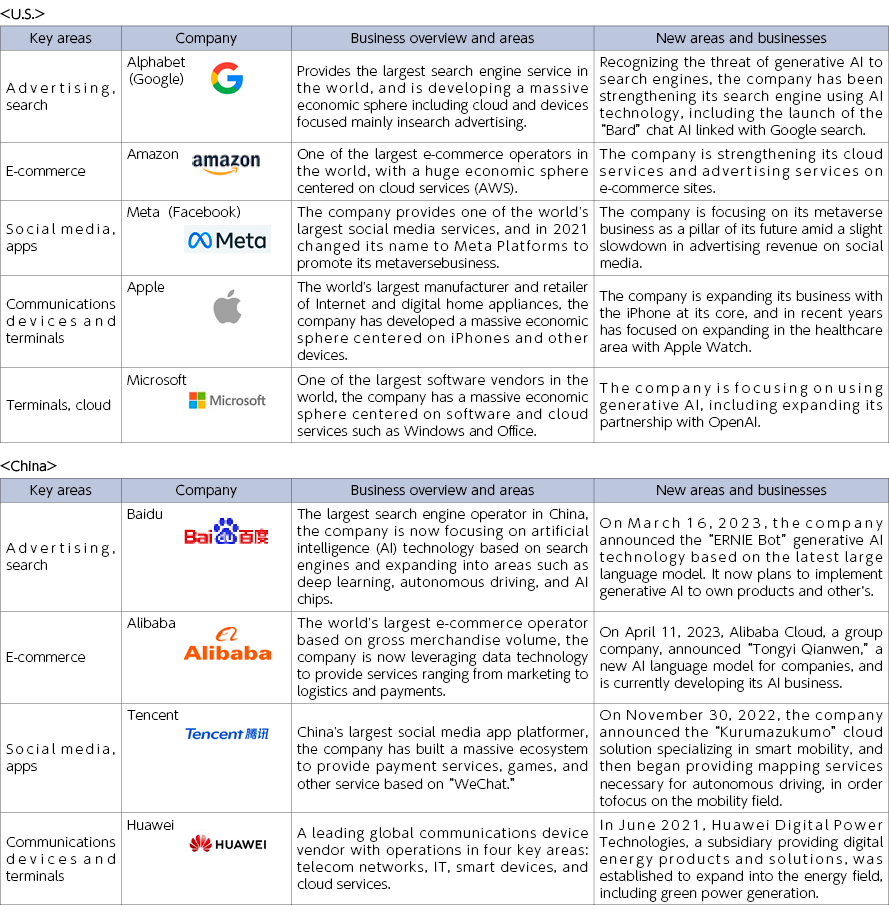
- Sales of major platform providers in the U.S. and China by business
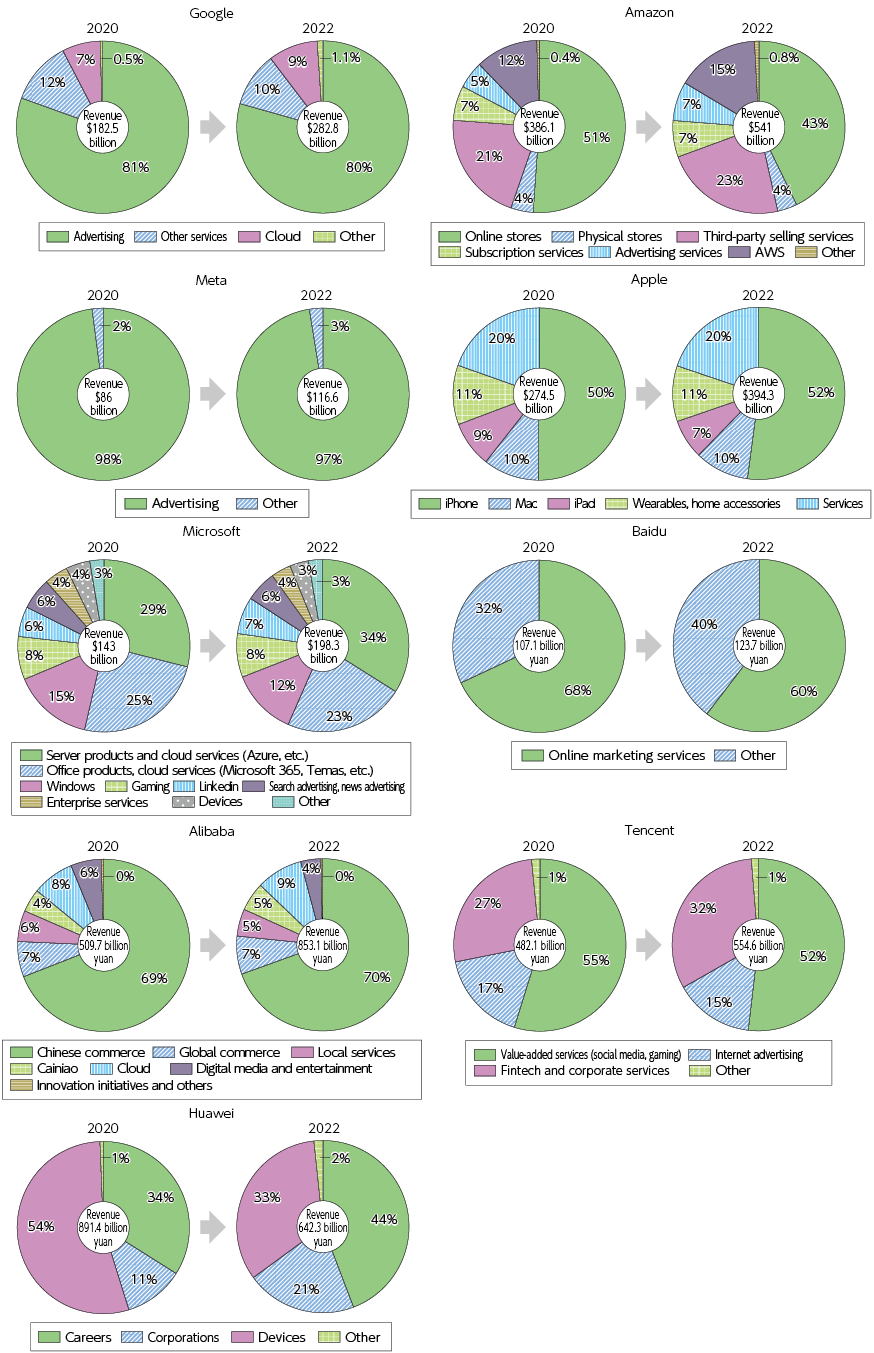
(Source) Prepared based on financial results material released by each company
Chapter 4 - Section 7
- Changes and forecast in the number of global social media users | (Figure 4-7-1-1 in White Paper)
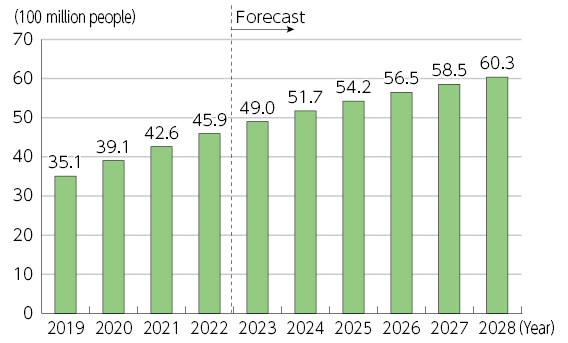
(Source) Statista
- Changes and forecast in the number of social media users in Japan | (Figure 4-7-1-2 in White Paper)
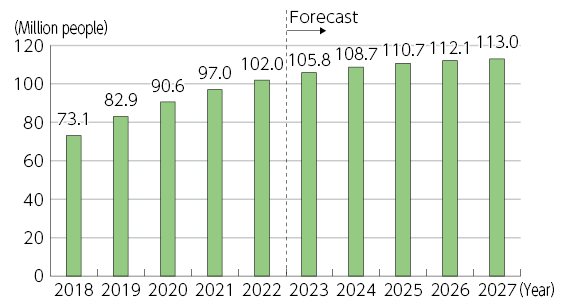
(Source) Statista
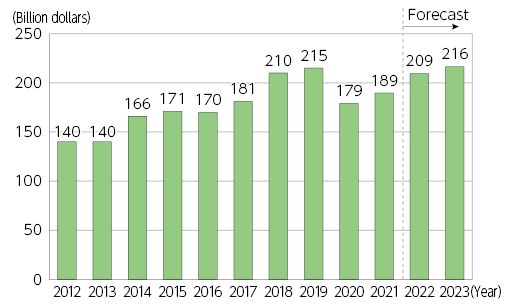
- Changes and forecast in sales in the global EC market
- Growth rate of EC market by country (2023 to 2027)
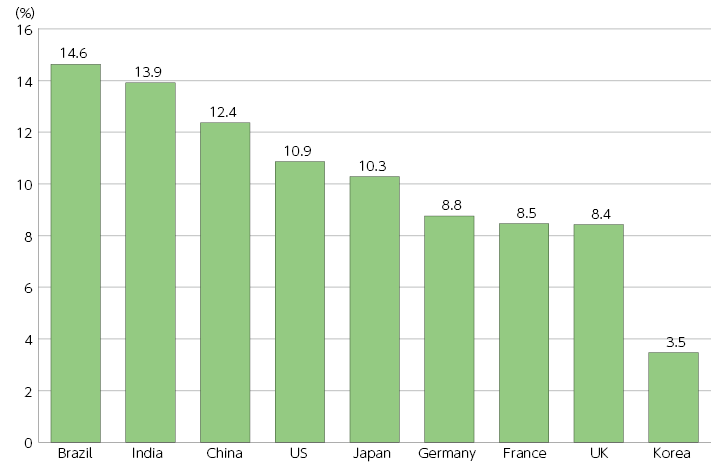
*Compound annual growth rate from 2023 to 2027
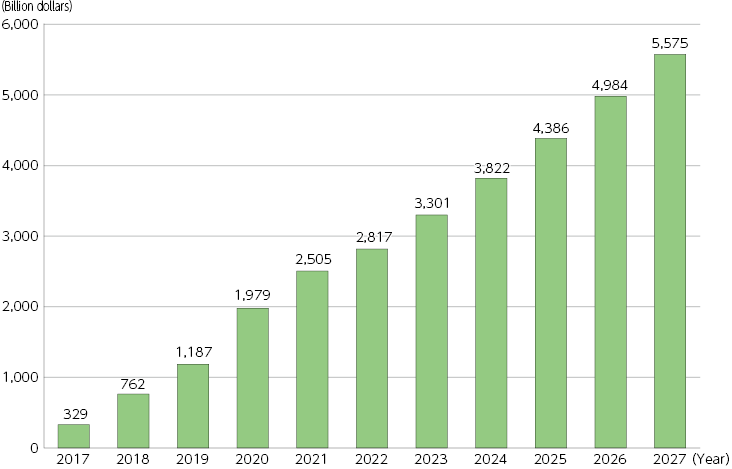
- Changes and forecasts for transaction values of global mobile payment
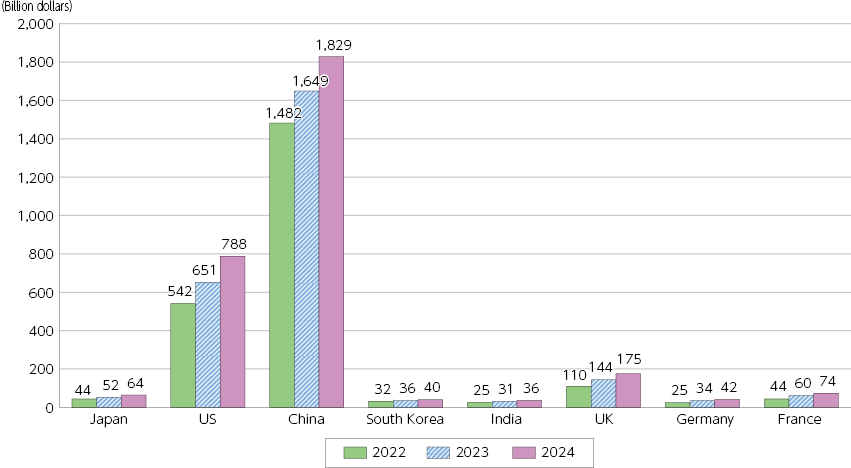
- Transaction values of mobile payment in each country (2021)
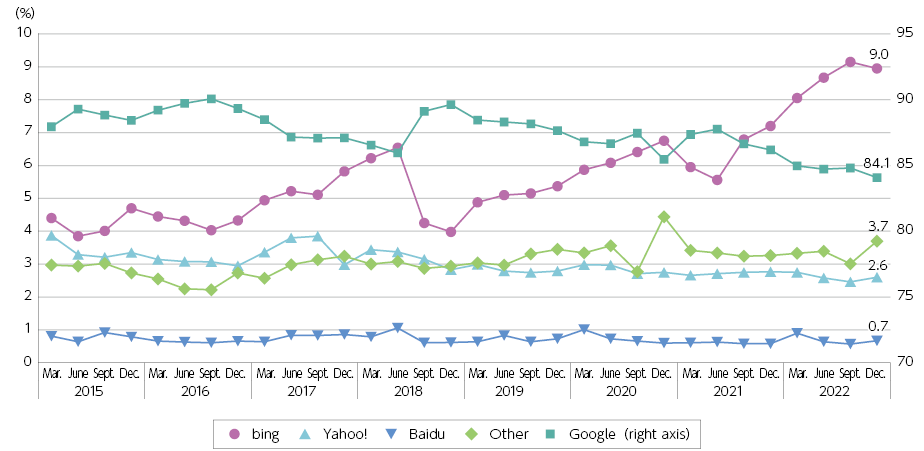
- Changes in global market share of search engines (Desktop)
- Changes in global market share of search engines (mobile)
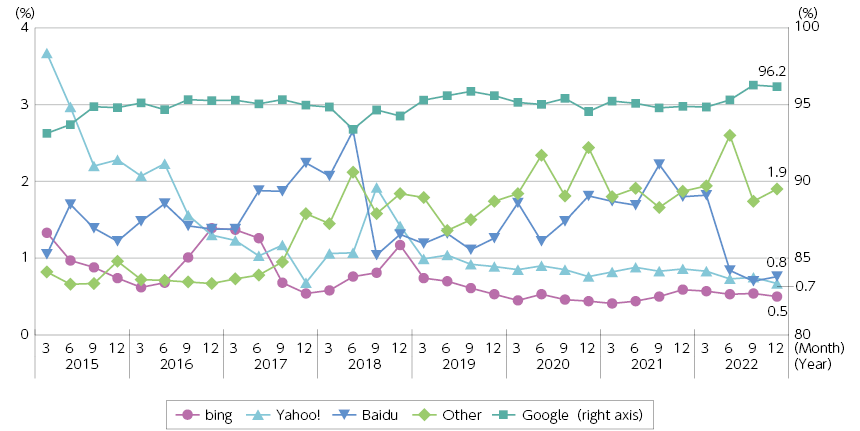
- Market share of search engines in Japan
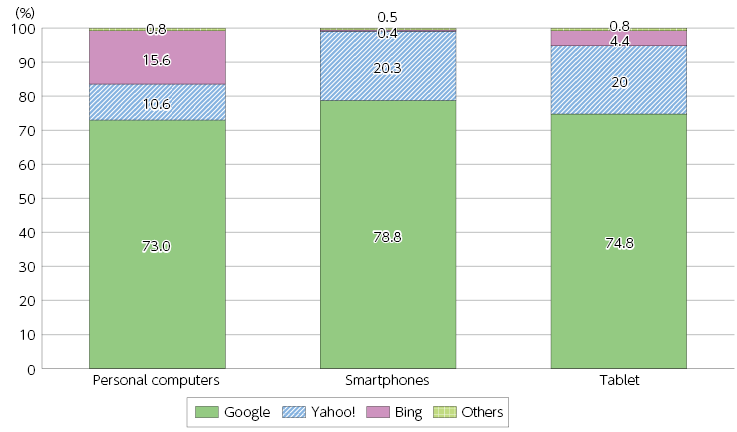
*PCs: As of September 2022; Smartphones and tablets: As of March 2022
- Changes and forecast in size of global video streaming, music streaming and E-book market
*Video streaming and e-books: Forecast for 2023 onward
*Music streaming: Forecast for 2022 onward
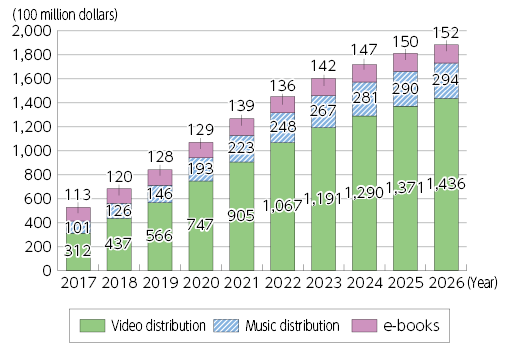
- Changes in the size of the Japanese video streaming, music streaming, and e-book markets | (Figure 4-7-4-1 in White Paper)
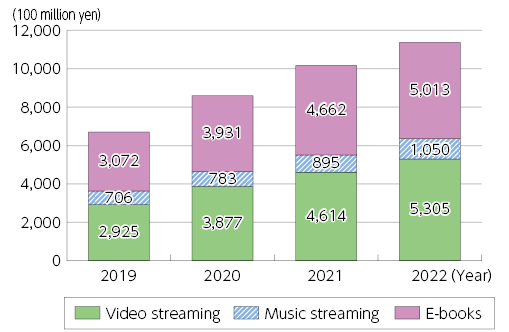
(Source) Prepared based on GEM Partners' “Video Streaming (VOD) Market Forecast for Five Years (2022 - 2026) Report,” the Recording Industry Association of Japan’s “Japan Recording Industry 2023,” and the All Japan Magazine and Book Publisher's and Editor's Association and Research Institute for Publications’ (2023) “Publishing Monthly Report.
- Changes in size of Japanese video streaming market
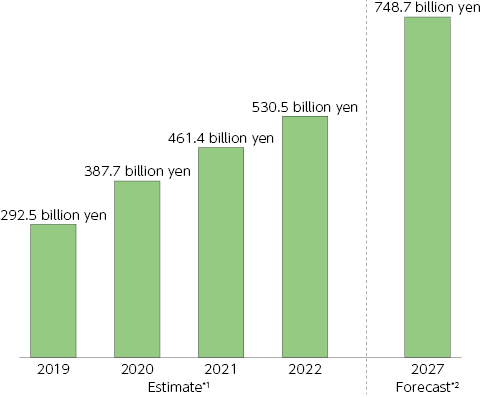
*1: Total amount paid by consumers to video streaming service providers regardless of contract type
*2: Based on the results of the consumer survey, calculations were made for three scenarios (base, optimistic, and pessimistic) taking into consideration the spread of video streaming in Japan and the U.S., the ratio of the DVD/BD market and video streaming with regard to overall video home entertainment, and the impact of the COVID-19 pandemic. This value is based on the "base" scenario
https://gem-standard.com/columns/674- Changes in the music distribution market in Japan
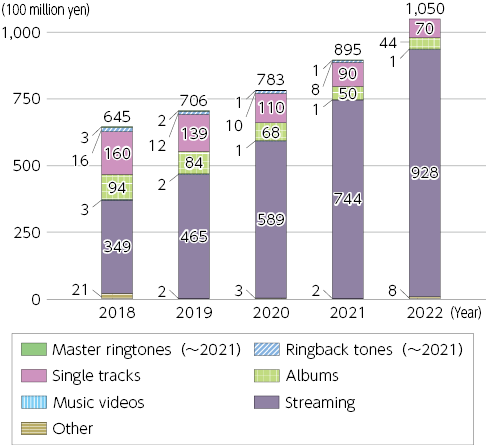
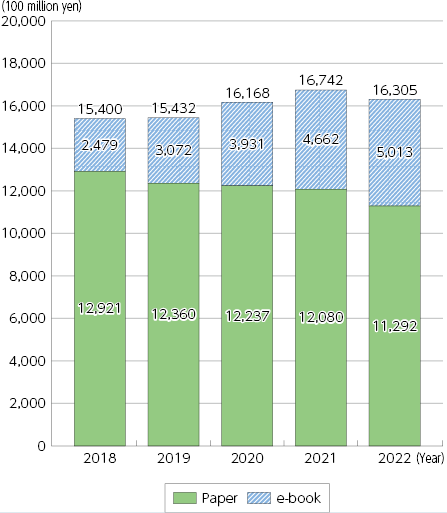
- Changes in the e-book market in Japan
- Transition and Forecast of Domestic Location and Geographic Information Service Market Size | (Figure 4-7-5-1 in White Paper)
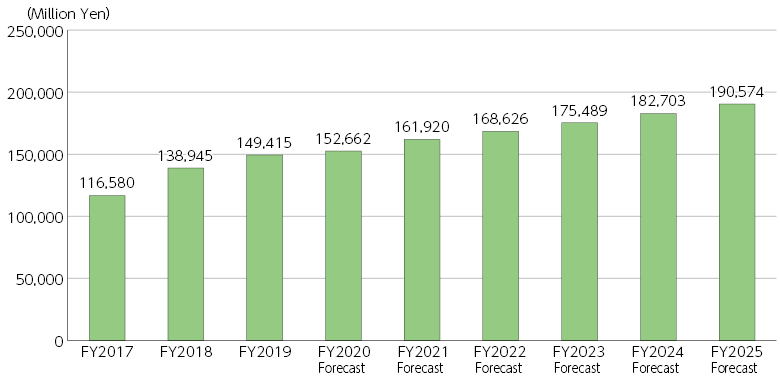
*1 Based on sales by business operators.
*2 The values for fiscal 2020 and later are forecasts.
*3 Market size was calculated based on (1) map databases, (2) GIS engines, and various GIS applications ((3) traffic related location applications, (4) store development/location advertisements, (5) spot store information/coupons/check-in, (6) location game applications, (7) IoT location applications, (8) delivery/logistics related location applications, (9) Industrial location applications, (10) location applications for infrastructure development, (11) traffic jam prevention location applications, (12) disaster prevention location applications).
(Source) Yano Research Institute Ltd., “Location and Geographic Information Service Market in Japan: Key Research Findings 2020” , November 5, 2020
- Transition and Forecast of Indoor Positioning Solutions Market Size | (Figure 4-7-5-2 in White Paper)
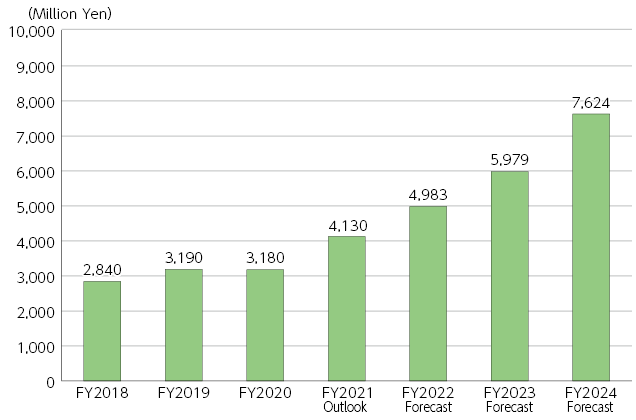
*1 Based on the sales of indoor location information service and solution providers
*2 Market size was calculated based on services and solutions that utilize indoor location information utilization using indoor positioning technology and indoor map information.
*3 The value for fiscal 2021 is an estimate, and the values for fiscal 2022 and later are forecasts.
(Source) Yano Research Institute Ltd., “Indoor Positioning Solutions Market in Japan: Key Research Finding 2021” , January 7, 2022
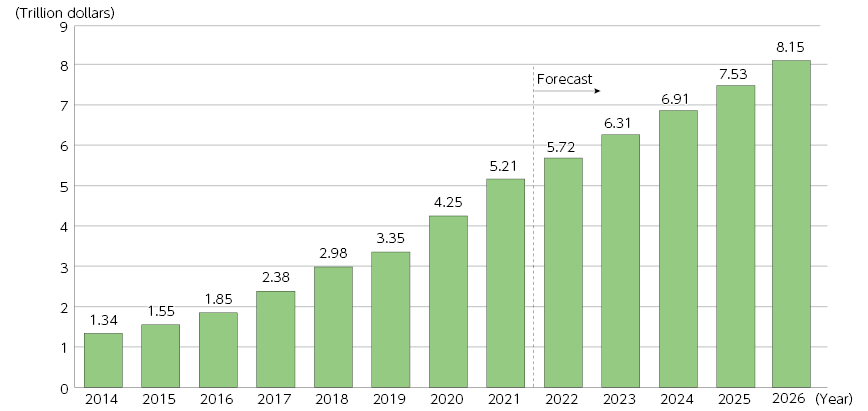
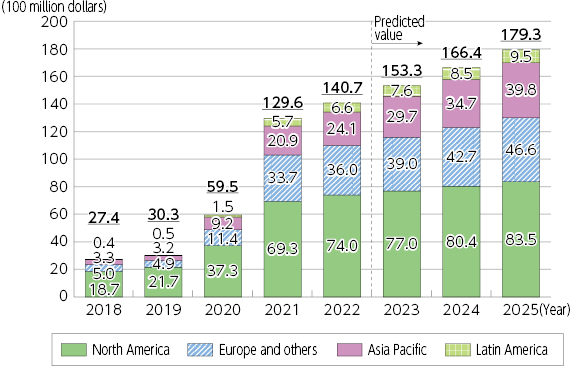
- Changes and forecast in the size of the global metaverse market | (Figure 4-7-5-3 in White Paper)
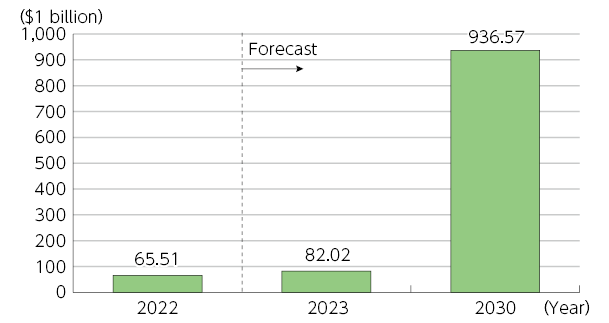
(Source) Statista
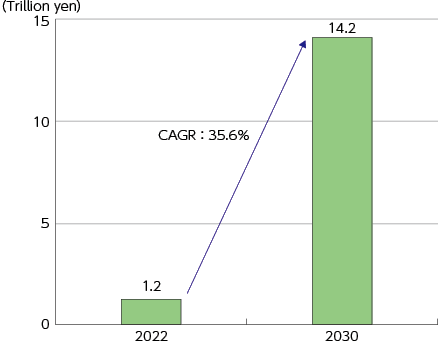
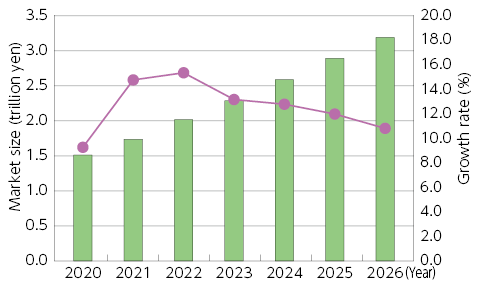
- Domestic Metaverse Market Size Forecast | (Figure 4-7-5-4 in White Paper)
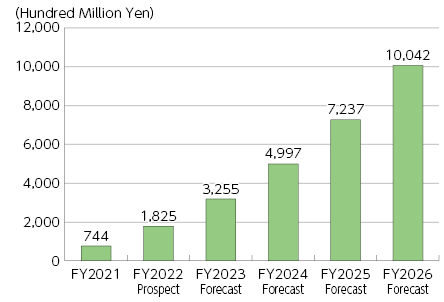
*1 Based on sales by business operators.
*2 The value for fiscal 2022 is an estimate, and the values for fiscal 2023 and later are forecasts.
*3 The total market size is the sum of metaverse platforms, non-platforms (content, infrastructure, etc.), and XR (VR, AR, MR) equipment. Note that XR (VR, AR, MR) equipment is calculated on a sales price basis.
(Source) Yano Research Institute Ltd., “Metaverse Market in Japan: Key Research Findings 2022, September 21” , 2022
- Size of the global digital twin market (by industry) | (Figure 4-7-5-5 in White Paper)
(Source) Statista (BIS Research)
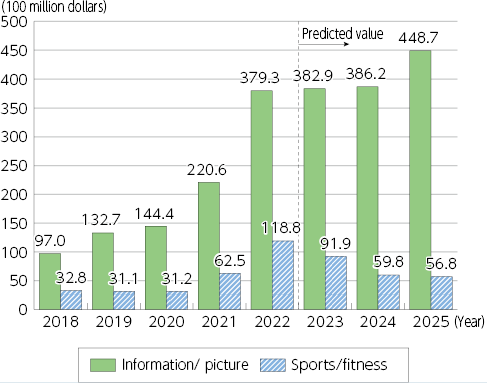
- Changes and forecasts for the size of the global video distribution markets and the number of contracts
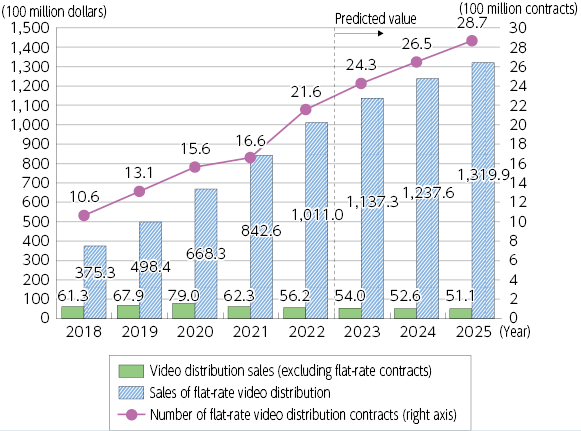
(Source) Omdia
- Changes and forecasts for the size of the global music distribution market
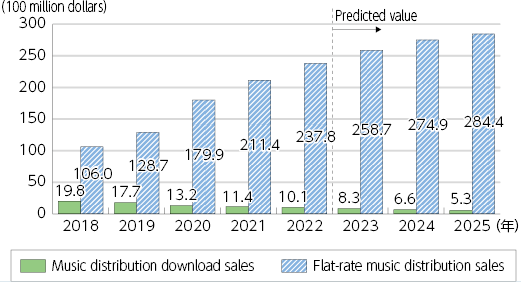
(Source) Omdia
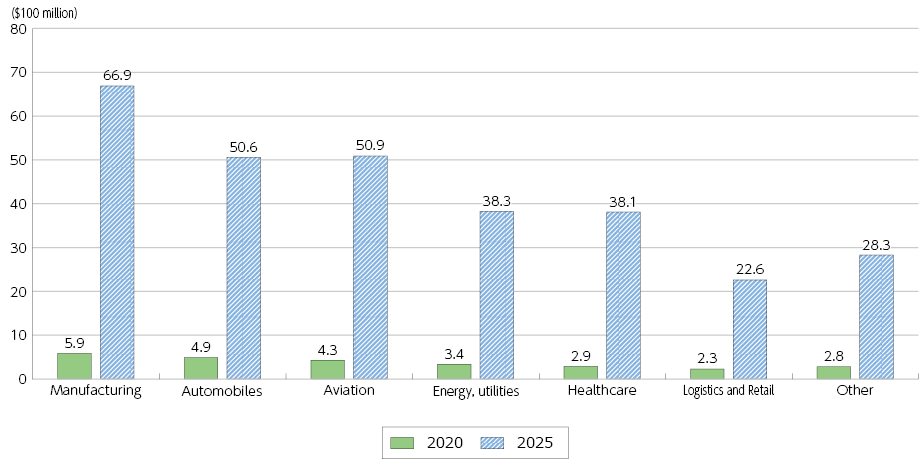
- Changes and forecasts for the size of the global mobile application market
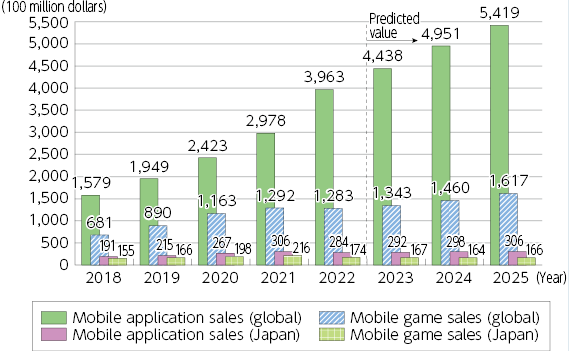
(Source) Omdia
- Changes and forecasts for the size of the global Web conference market
(Source) Omdia
Chapter 4 - Section 8
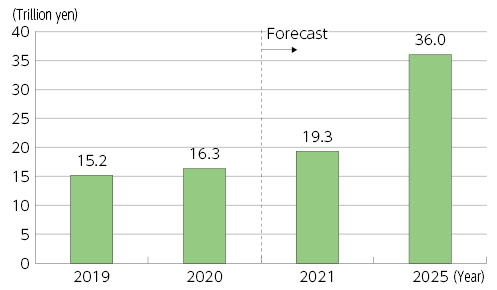
- Changes and forecast in the size of the global data center systems market (in terms of expenditure) | (Figure 4-8-1-1 in White Paper)
(Source) Statista (Gartner)
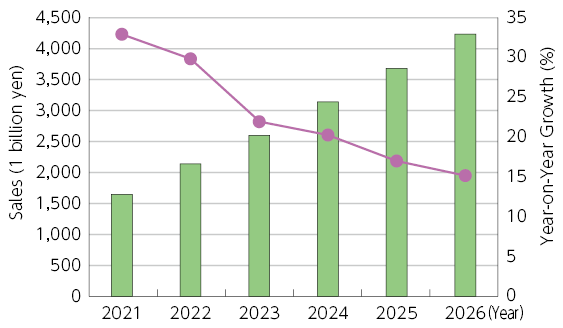
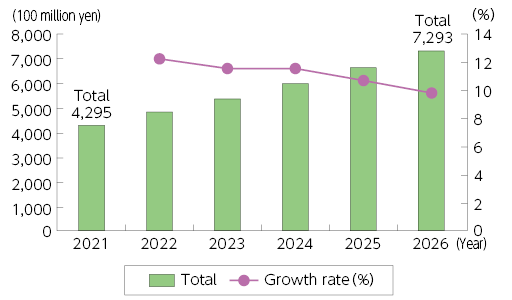
- Changes and forecast in the size (in terms of sales) of the Japanese data center services market | (Figure 4-8-1-2 in White Paper)
*2022 is an estimate, and 2023 and beyond are forecasts.
(Source) IDC “Japan Datacenter Services Forecast” (August 29, 2022)
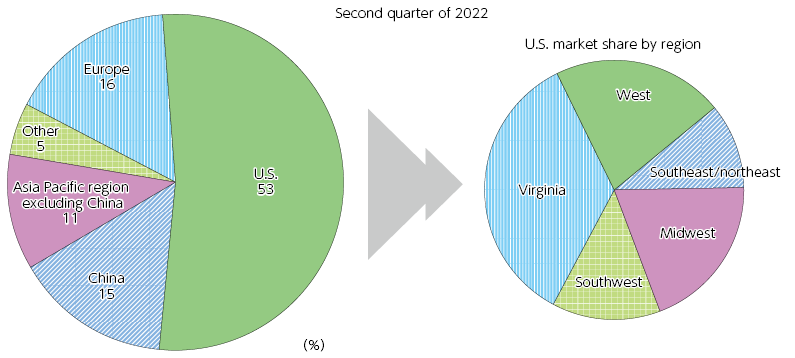
- Share of global large-scale data center market by region (data capacity)
- Changes and forecast in the size (in terms of sales) of the global public cloud service market | (Figure 4-8-2-1 in White Paper)
(Source) Omdia
- Share of the global public cloud services market | (Figure 4-8-2-2 in White Paper)
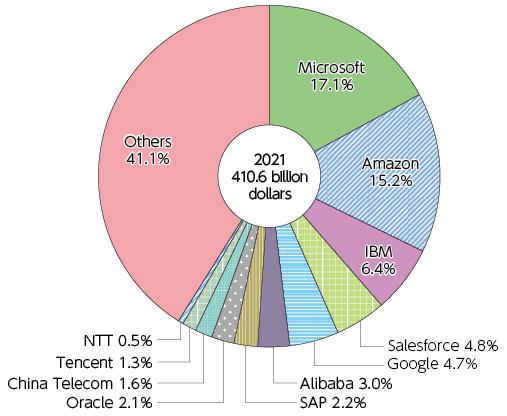
(Source) Omdia
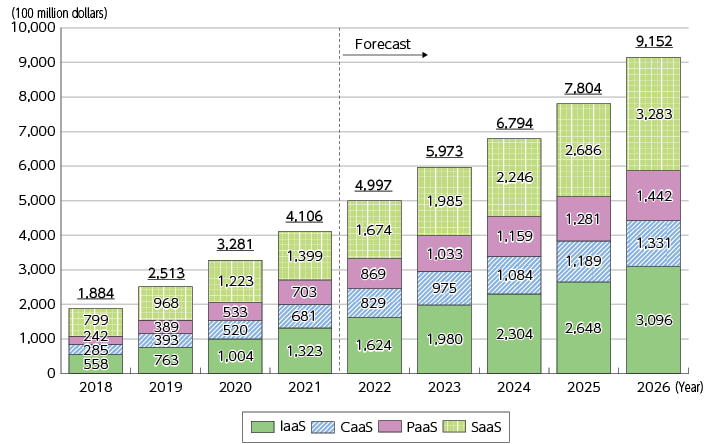
- Changes and forecast in the size (in terms of sales) of the Japanese public cloud service market | (Figure 4-8-2-3 in White Paper)
(Source) IDC “Japan Public IT Cloud Services Forecast” (September 15, 2022)
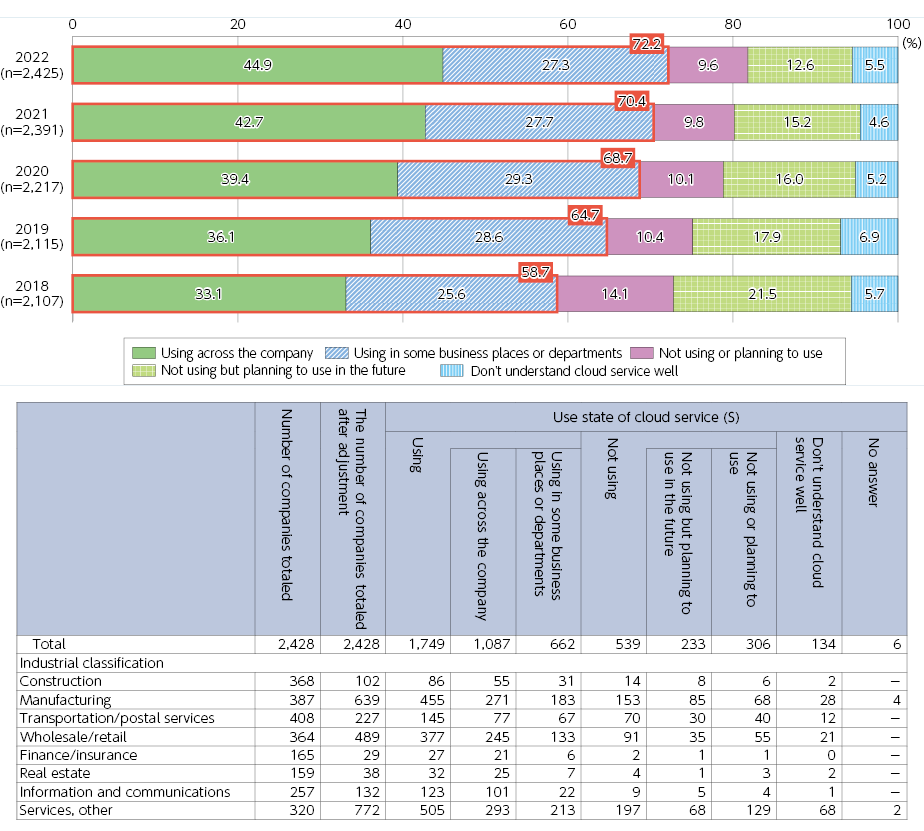
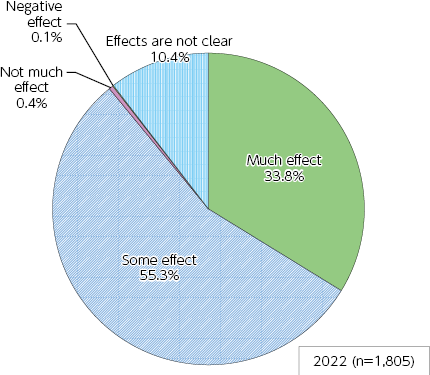
- Enterprise cloud service usage
- Effect of cloud service usage in enterprises
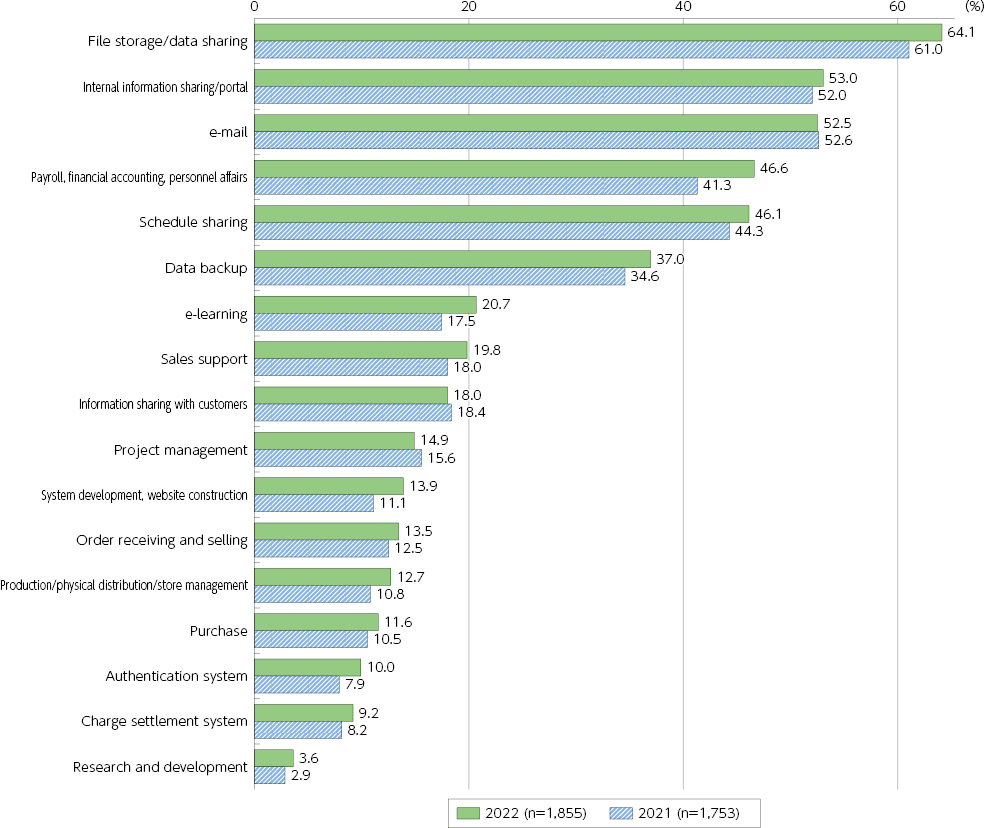
- Cloud services used in enterprises (multiple selections allowed)
- Changes and forecast in the size of the global edge infrastructure market (revenue) | (Figure 4-8-3-1 in White Paper)
*2025 is calculated at the 2022 exchange rate
(Source) Statista (IDC)
- Changes and forecast in the size (in terms of expenditure) of the Japanese edge infrastructure market | (Figure 4-8-3-2 in White Paper)
(Source) IDC “Japan Edge Infrastructure Forecast” (January 18, 2023)
- Changes and forecast in the size (in terms of sales) of the Japanese edge AI solutions market
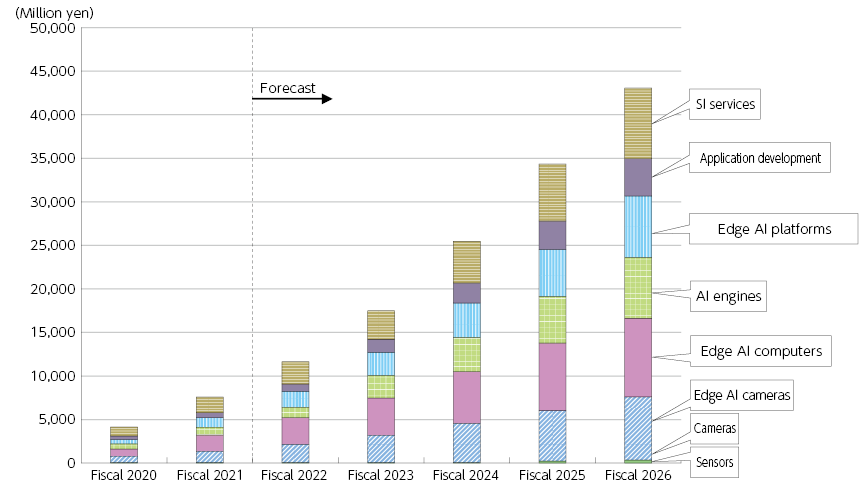
(Source) Deloitte Tohmatsu MIC Research Institute "Reality and Future Prospects of Edge AI Computing Market" (October 24, 2022)
https://mic-r.co.jp/mr/02530/
Chapter 4 - Section 9
- Changes and forecast in the size (in terms of sales) of the global AI market | (Figure 4-9-1-1 in White Paper)
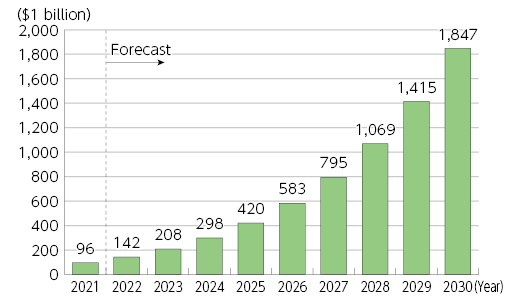
(Source) Statista (Next Move Strategy Consulting)
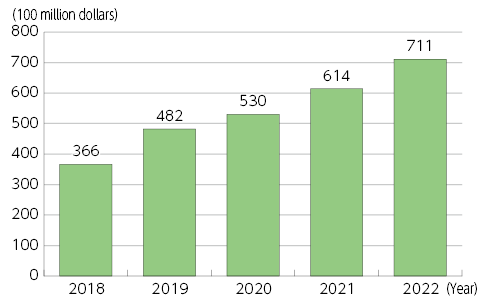
- Size (in terms of expenditure) of the Japanese AI systems market and forecast | (Figure 4-9-1-2 in White Paper)
(Source) IDC “Japan Artificial Intelligence Systems Forecast” (April 27, 2023)
- Number of newly funded AI companies by country (2022) | (Figure 4-9-2-1 in White Paper)
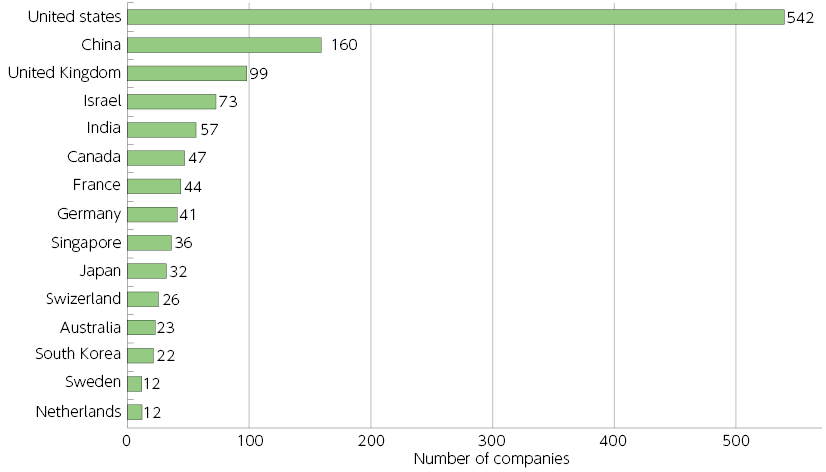
(Source) Stanford University “Artificial Intelligence Index Report 2023
- Changes in AI rankings by country (top 10)
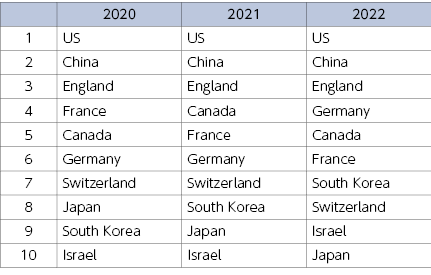
*Thundermark Capital ranks leading countries, companies, and universities based on factors such as the number of papers published
- Changes in AI rankings by organization (top 10)
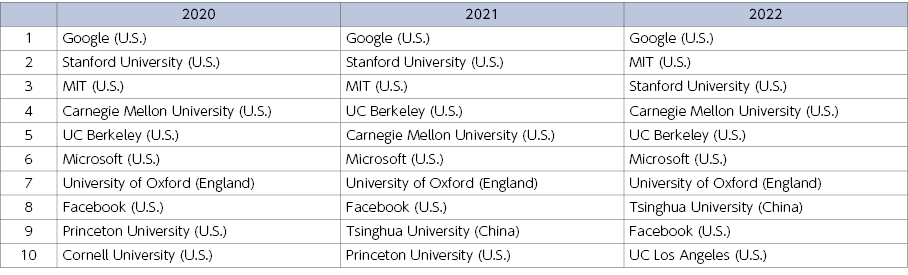
*Thundermark Capital ranks leading countries, companies, and universities based on factors such as the number of papers published
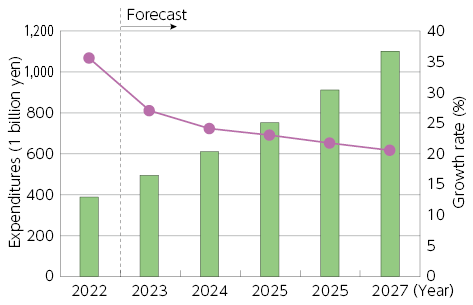
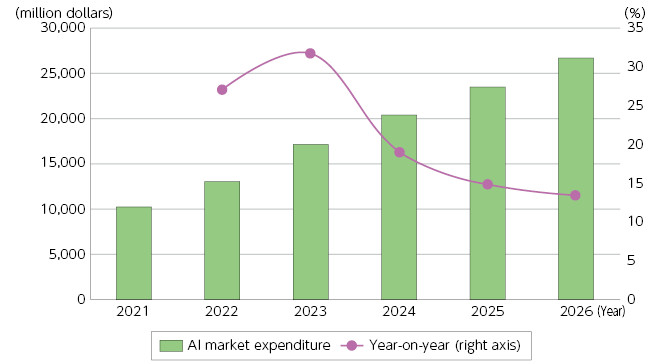
- China's AI market expenditure forecast
Chapter 4 - Section 10
- Changes in global cybersecurity market size (sales) | (Figure 4-10-1-1 in White Paper)
(Source) Based on Canalys estimates
- Global cybersecurity market size (by product category)
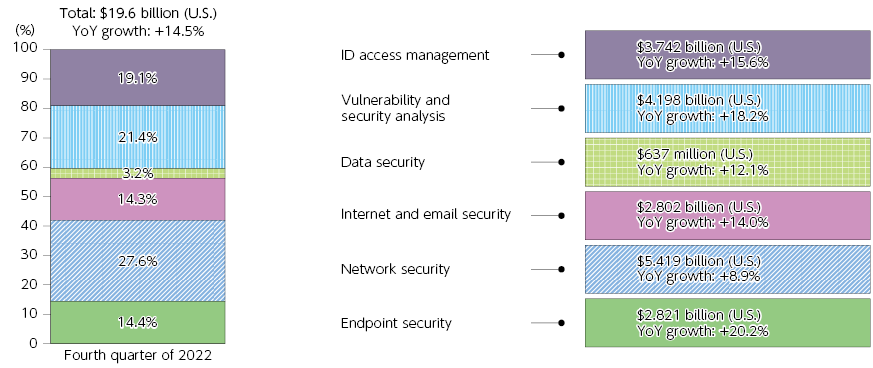
(Source) Based on Canalys “Strong channel sales propel the cybersecurity market to US$20 billion in Q4 2022”
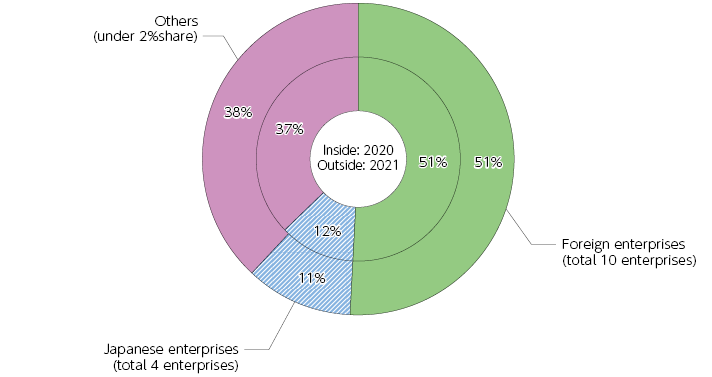
- Major global cybersecurity companies
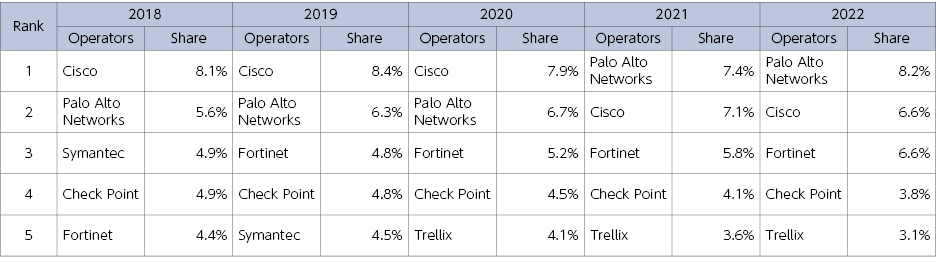
(Source) Based on Canalys data
- Domestic information security products market share (sales), 2020-2021 | (Figure 4-10-1-2 in White Paper)
(Source) Based on IDC Japan, July 2022 “Japan IT Security Products Market Shares, 2021: External Threat Measures and Internal Threat Measures” (JPJ47880222)
- Changes in the number of cyberattack-related communications detected by NICTER | (Figure 4-10-2-1 in White Paper)
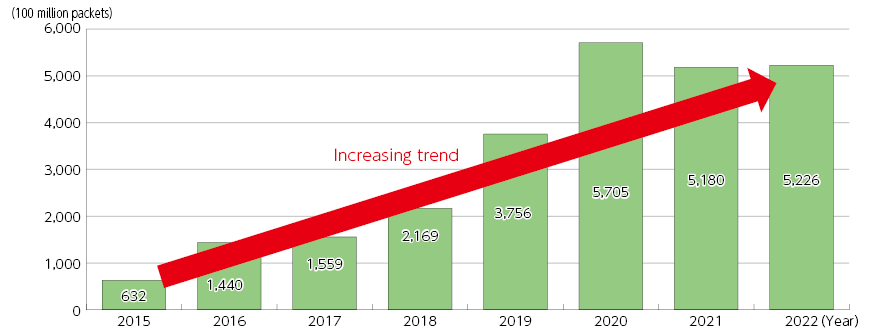
(Source) Based on NICT "NICTER Observation Report 2022
- Targets of cyberattack-related communications detected by NICTER | (Figure 4-10-2-2 in White Paper)
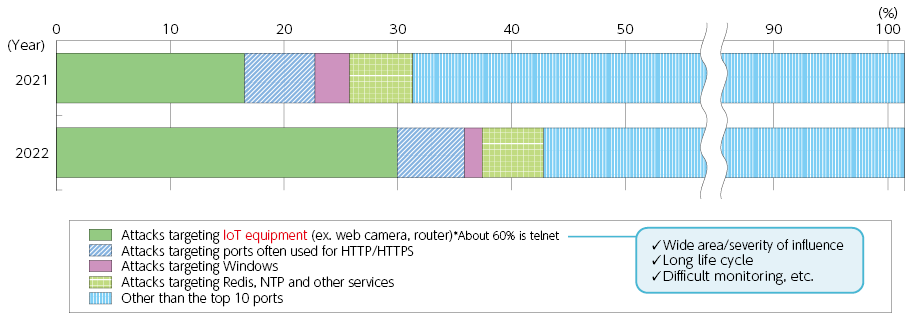
(Source) Based on “NICTER Observation Report 2022” of National Institute of Information and Communications Technology
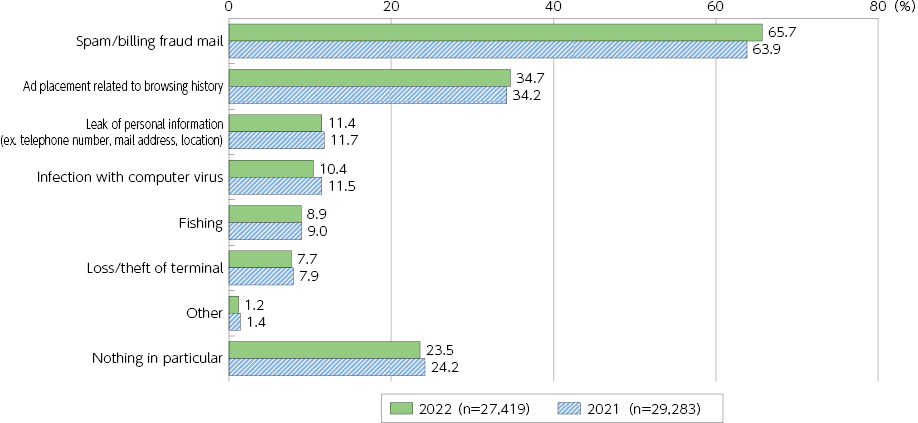
- Damage when using personal information and communication equipment (multiple answers)
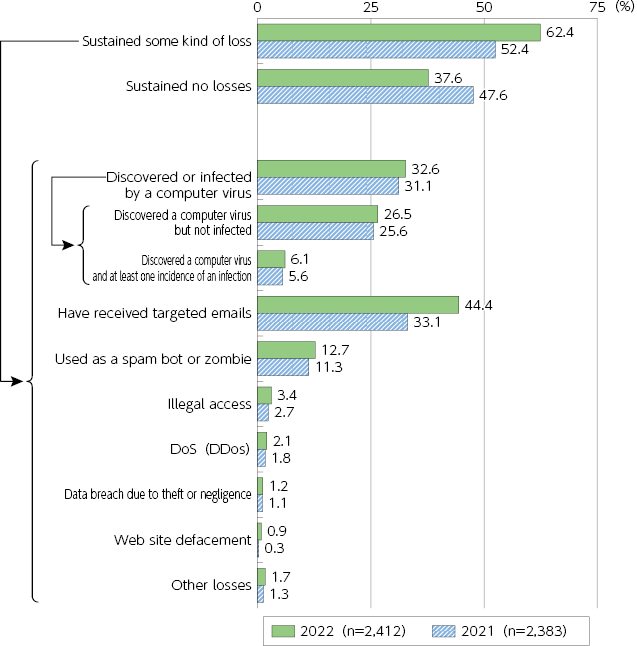
- Security intrusion when using an information and communication network in enterprises (multiple answers)
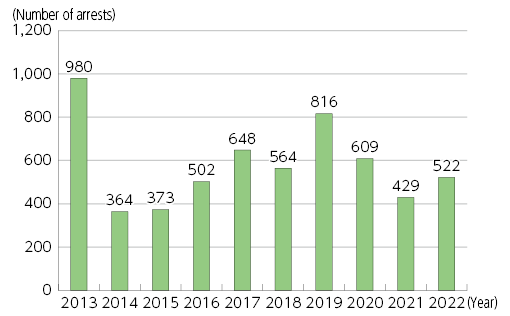
- Changes in arrests for violation of the Unauthorized Access Prohibition Act
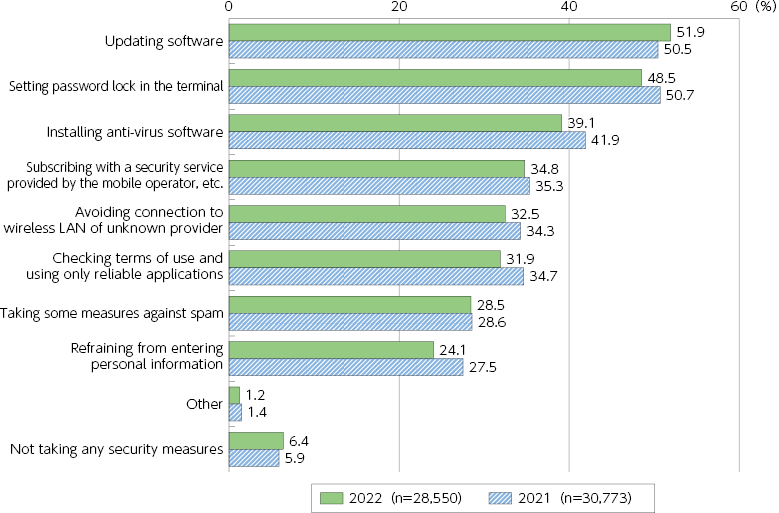
- Implementation status of information security measures by individuals (multiple answers)
- Economic losses caused by cybersecurity issues | (Figure 4-10-2-3 in White Paper)
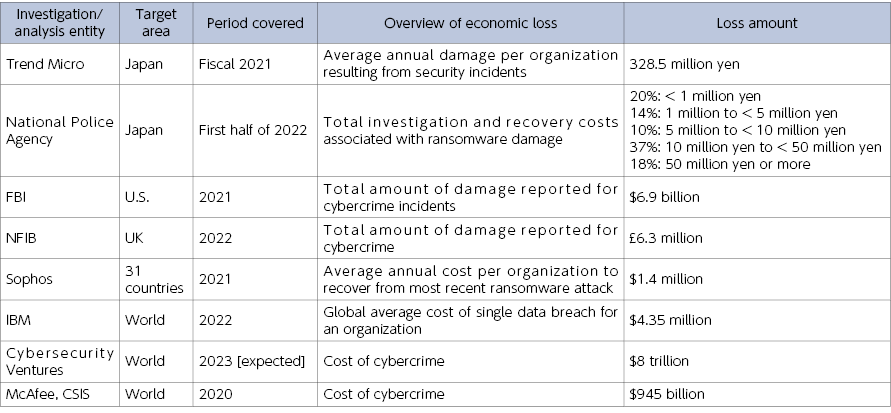
(Source) Based on the published materials of each company
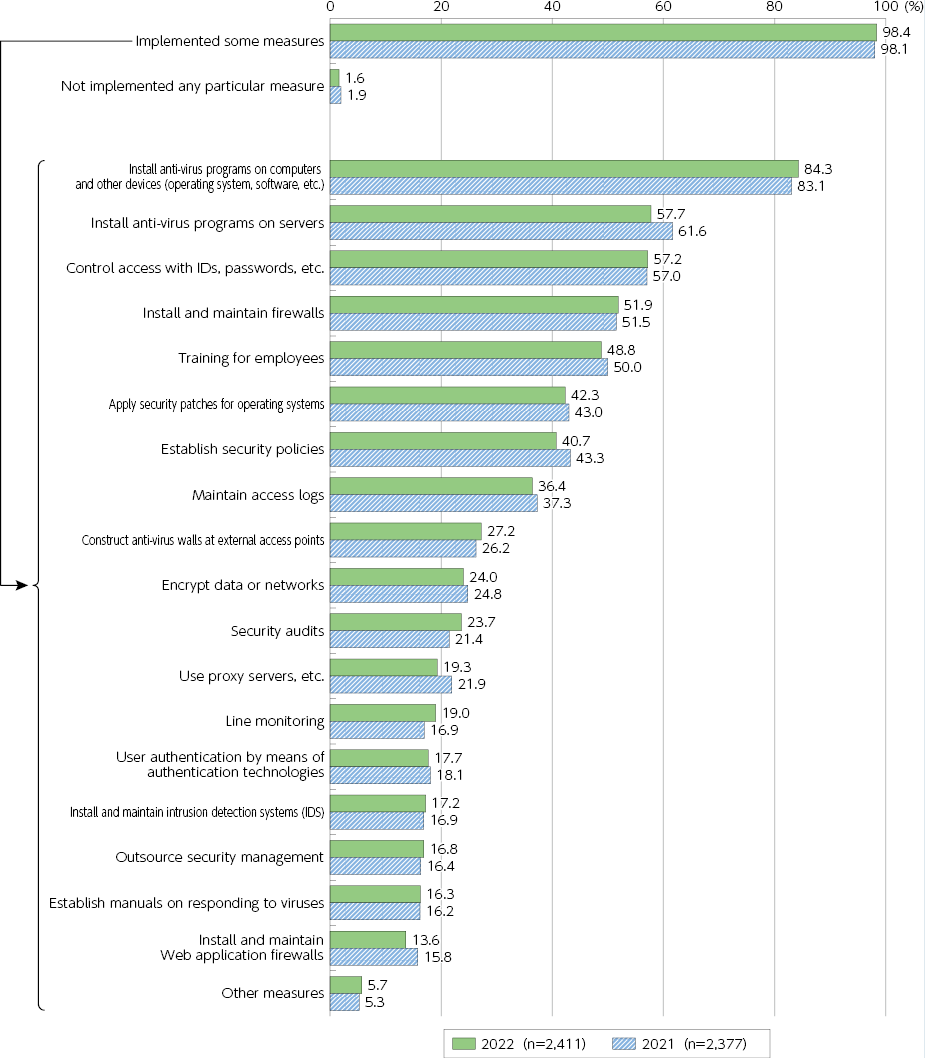
- Implementation status of information security measures by enterprises (multiple answers)
- Using or not using public wireless LAN
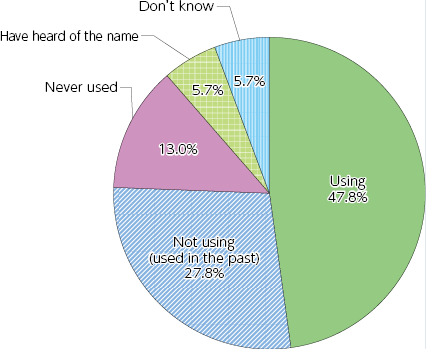
(Source) Prepared from MIC, “Fiscal 2022 Result of Survey of Wireless LAN Users”
- Reasons for not using public wireless LAN (multiple answers)
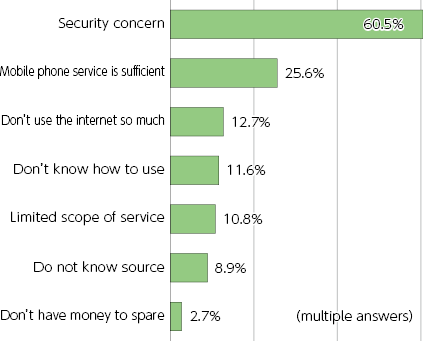
(Source) Prepared from MIC, “Fiscal 2022 Result of Survey of Wireless LAN Users”
- Anxiety about security of public wireless LAN (multiple answers)
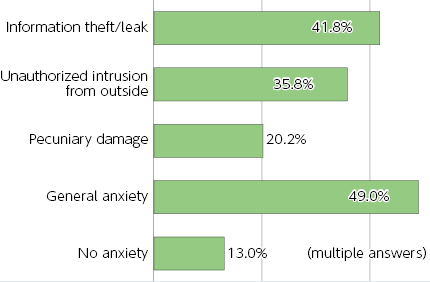
(Source) Prepared from MIC, “Fiscal 2022 Result of Survey of Wireless LAN Users”
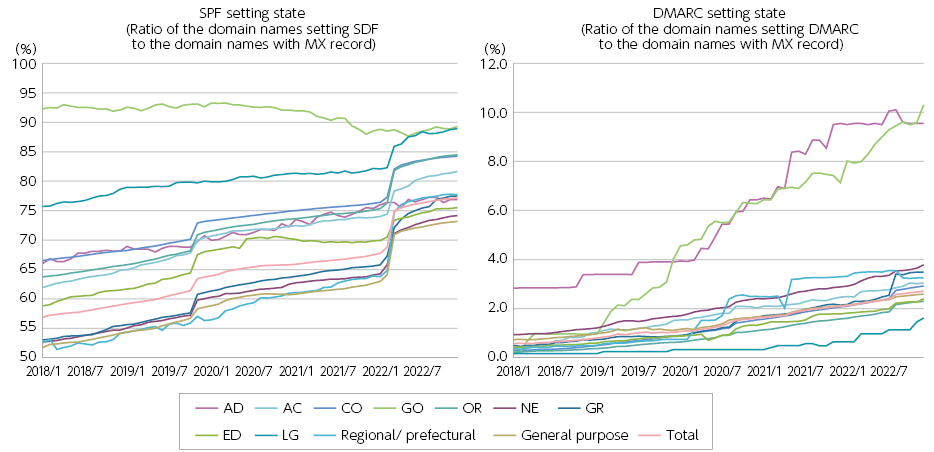
- Introduction of sender domain authentication technologies for JP domains
Chapter 4 - Section 11
- Changes in household ownership of ICT devices | (Figure 4-11-1-1 in White Paper)
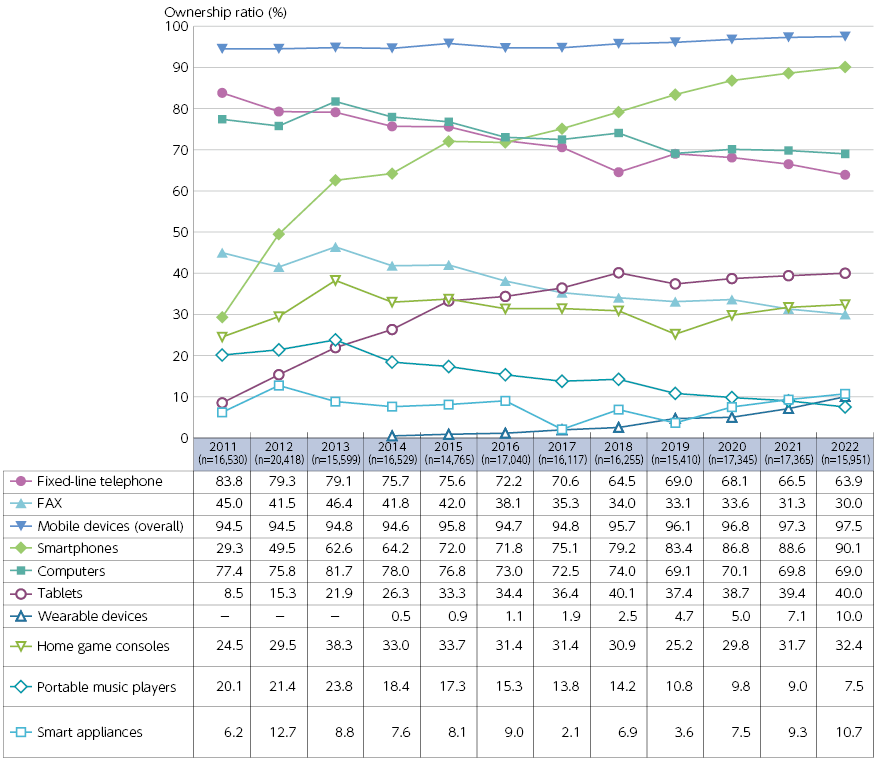
(Source) MIC “Communications Usage Trend Survey”
- Mobile device ownership
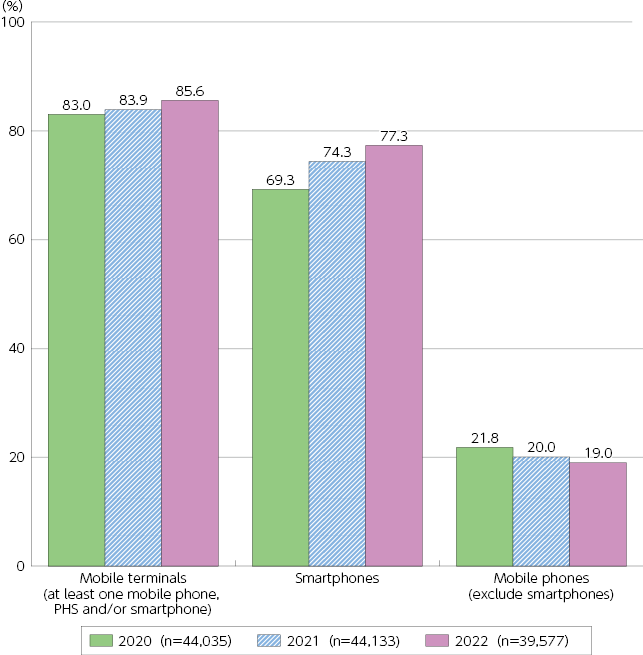
*“Mobile devices” and “mobile phones (excluding smartphones)” in 2020 include PHS.
*"Smartphones" in 2020 excludes 5G devices.
- Changes in Internet usage rate (individuals) | (Figure 4-11-1-2 in White Paper)
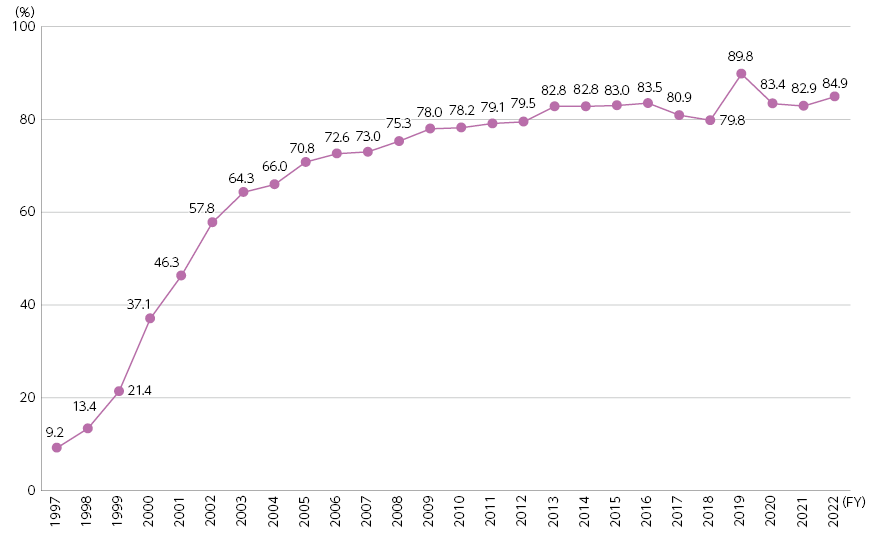
(Source) MIC “Communications Usage Trend Survey”
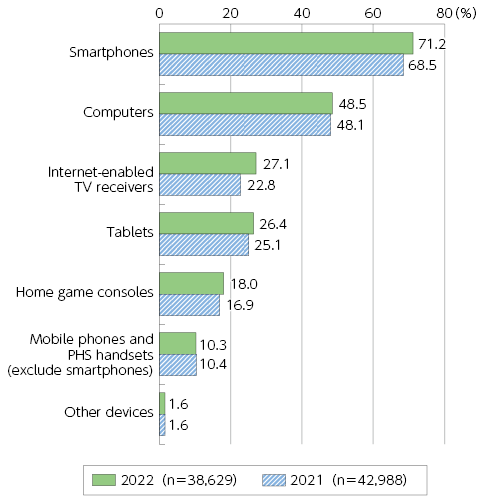
- Types of Internet devices (individual)
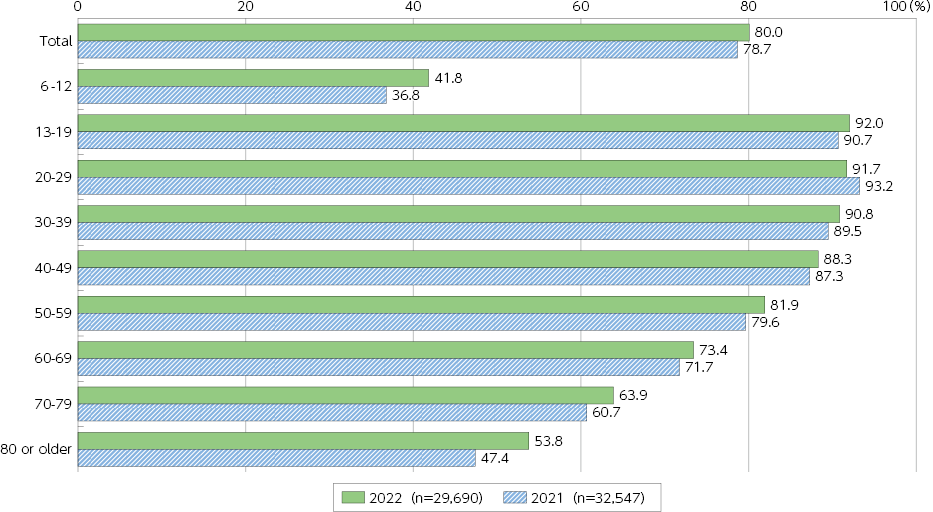
- Internet usage by age group | (Figure 4-11-1-3 in White Paper)
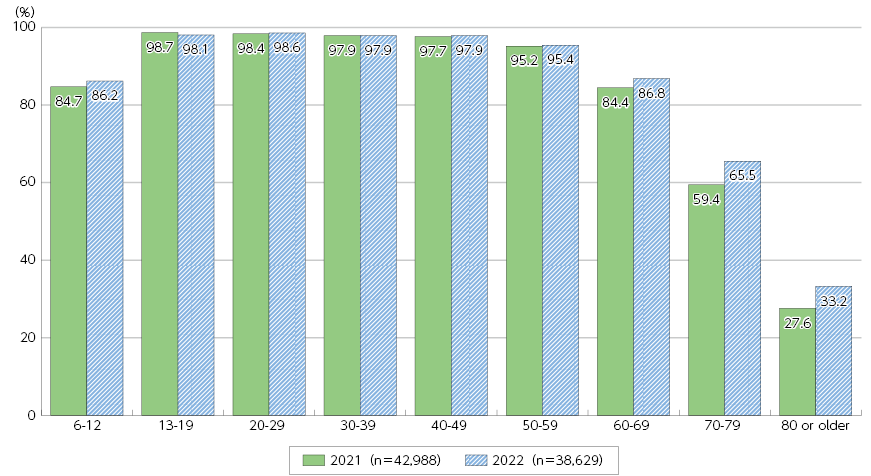
(Source) MIC “Communications Usage Trend Survey”
- Internet usage by annual household income | (Figure 4-11-1-4 in White Paper)
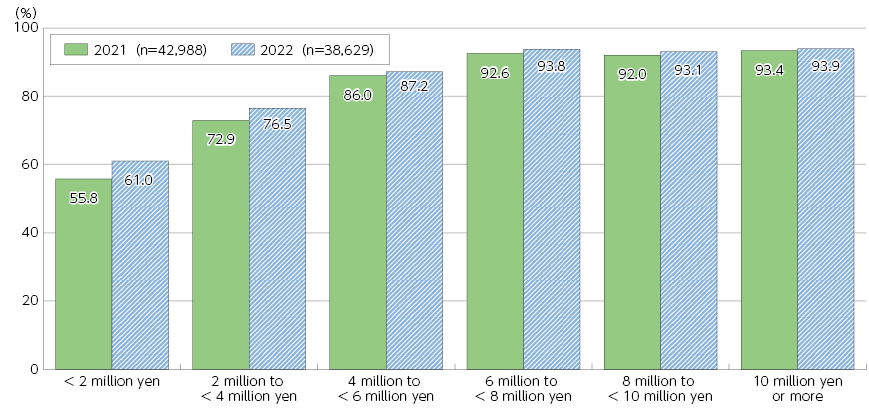
(Source) MIC “Communications Usage Trend Survey”
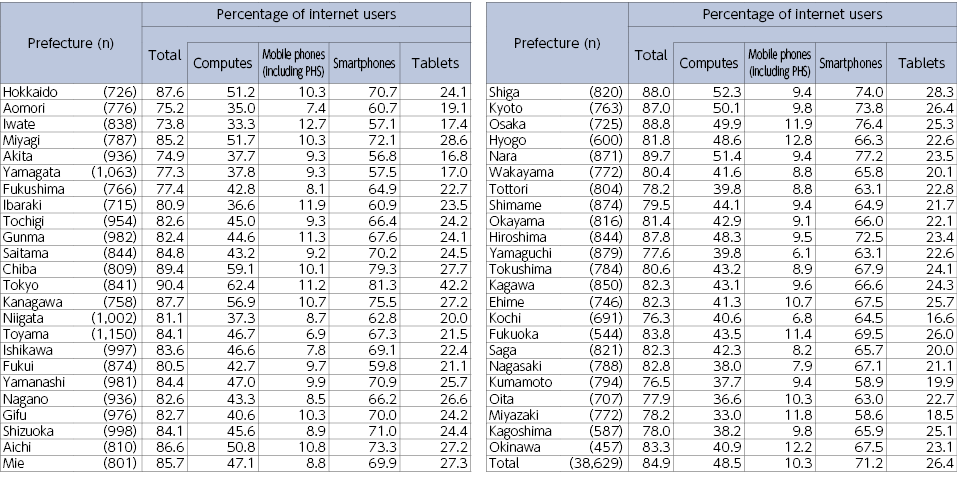
- Internet usage by prefecture and usage by device (individual) (2022)
- Percentage of individuals who feel anxiety when using the Internet | (Figure 4-11-1-5 in White Paper)
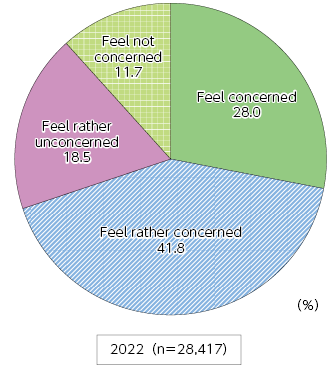
(Source) MIC “Communications Usage Trend Survey”
- Anxiety felt when using the Internet (multiple answers allowed) | (Figure 4-11-1-6 in White Paper)
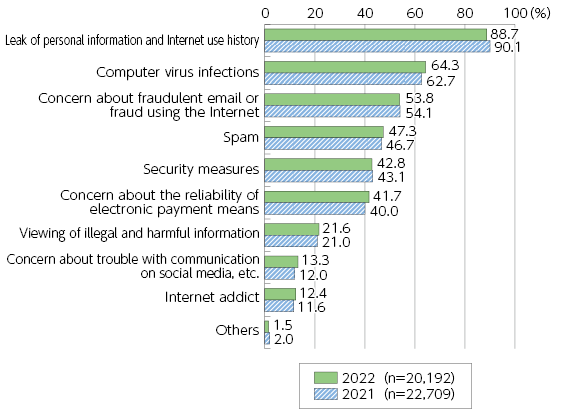
(Source) MIC “Communications Usage Trend Survey”
- Overall usage of digital services | (Figure 4-11-1-7 in White Paper)
(Source) MIC (2023) “Survey Research on R&D on the Latest Information and Communications Technologies and Trends of Use of Digital Technologies in Japan and Abroad”
- Usage of interactive entertainment services in virtual spaces (comparison by country) | (Figure 4-11-1-8 in White Paper)
(Source) MIC (2023) “Survey Research on R&D on the Latest Information and Communications Technologies and Trends of Use of Digital Technologies in Japan and Abroad”
- Usage of interactive entertainment services in virtual spaces (by age)
(Source) MIC (2023) “Survey Research on R&D on the Latest Information and Communications Technologies and Trends of Use of Digital Technologies in Japan and Abroad”
- Reasons why entertainment services in virtual spaces are unavailable
(Source) MIC (2023) “Survey Research on R&D on the Latest Information and Communications Technologies and Trends of Use of Digital Technologies in Japan and Abroad”
- Changes in telephone charge and its ratio to living expenditure
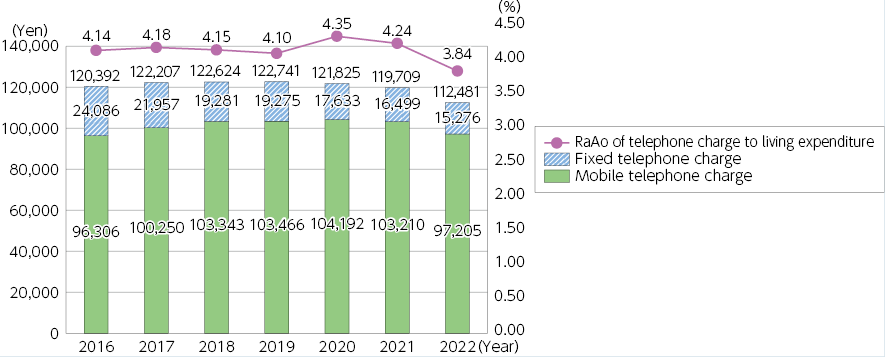
*Household accounts used in the survey have been revised since January 2018, and care should be taken when making chronological comparisons over a period that includes 2018 or covers 2018, as changes due to the revision are included.
*Certain figures for 2021 differ from previously published figures due to revisions.
- Household expenditure for broadcast services
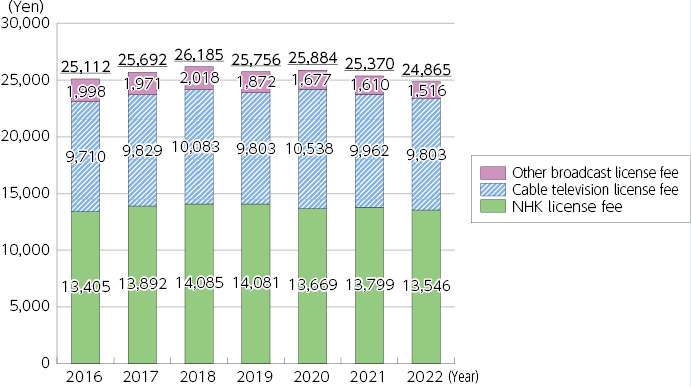
*Household accounts used in the survey have been revised since January 2018, and care should be taken when making chronological comparisons over a period that includes 2018 or covers 2018, as changes due to the revision are included.
*Certain figures for 2021 differ from previously published figures due to revisions.
(Source) Based on MIC "Survey on Household Income and Expenditures" (total households): Annual Report on Survey on Household Income and Expenditures (household income and expenditure) (Item classification) Table 10 Annual income five categories per household by class
https://www.stat.go.jp/data/kakei/index.html- Annual content-related expenditure per household
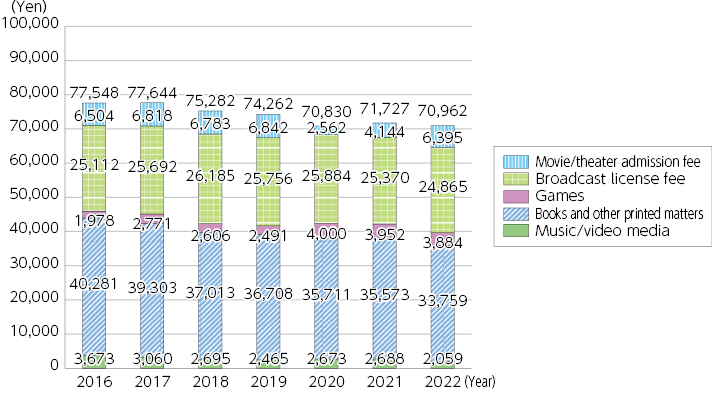
*“Game” is sum of “Game device” and “Game software, etc.”
*Household accounts used in the survey have been revised since January 2018, and care should be taken when making chronological comparisons over a period that includes 2018 or covers 2018, as changes due to the revision are included.
*Certain figures for 2021 differ from previously published figures due to revisions.
- Average usage time for major media and user ratio | (Figure 4-11-1-9 in White Paper)
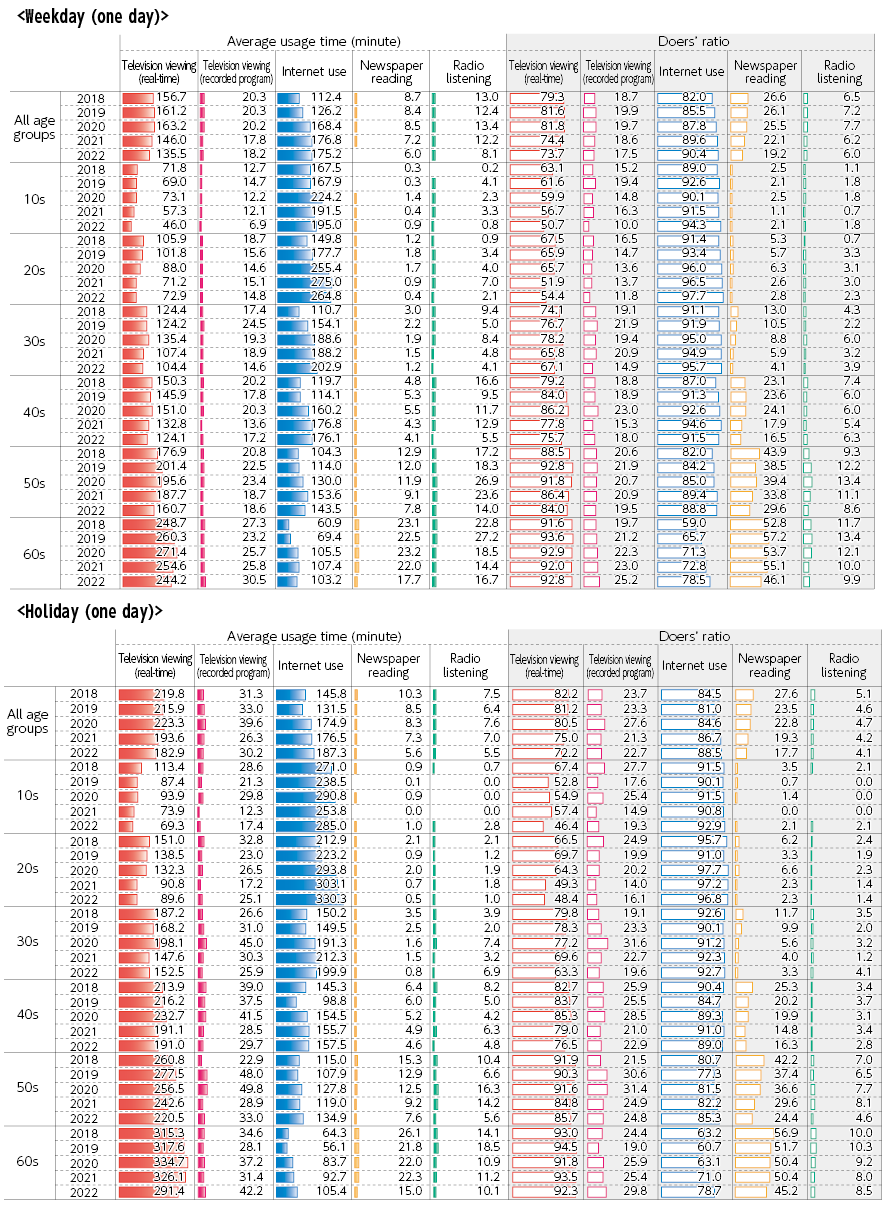
(Source) MIC Institute for Information and Communications Policy “Fiscal 2022 Survey on Information and Communications Media Usage Time and Information Behavior”
- User ratio of major media by time of day (all ages) (2022)
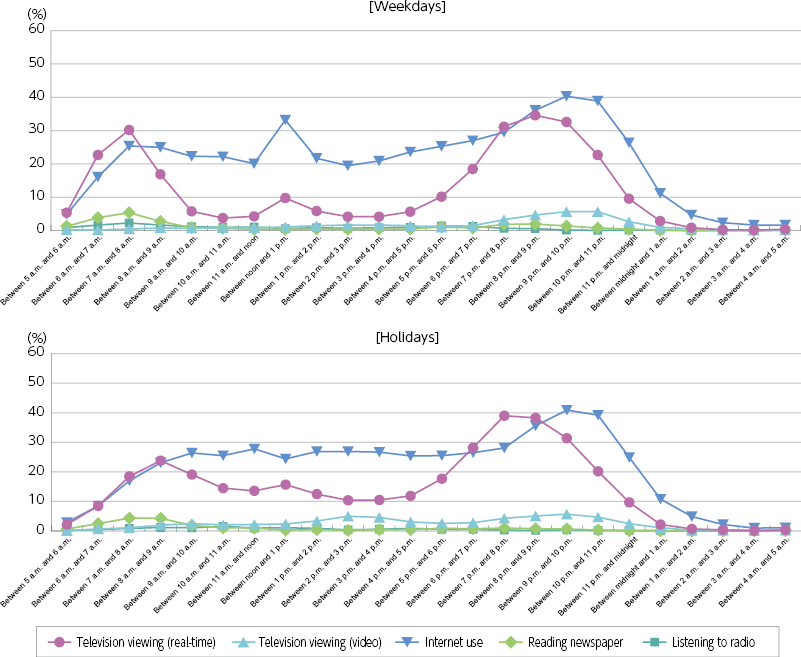
(Source) Institute for Information and Communications Policy, MIC, “FY2022 Survey on Usage Time of Information and Communication Media and Information Behavior”
- Internet usage time and doers’ ratio with major equipment
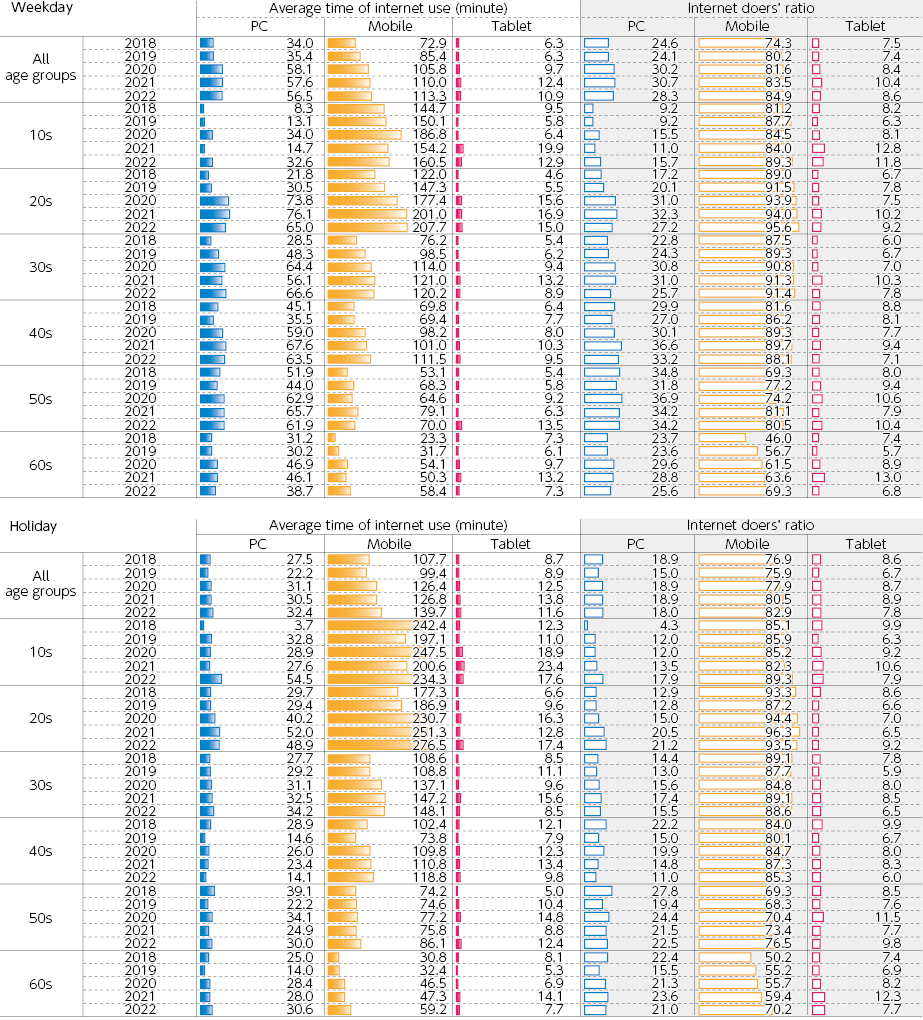
(Source) Institute for Information and Communications Policy, MIC, “FY2022 Survey on Usage Time of Information and Communication Media and Information Behavior”
- Usage time and doers’ ratio of major means of communication
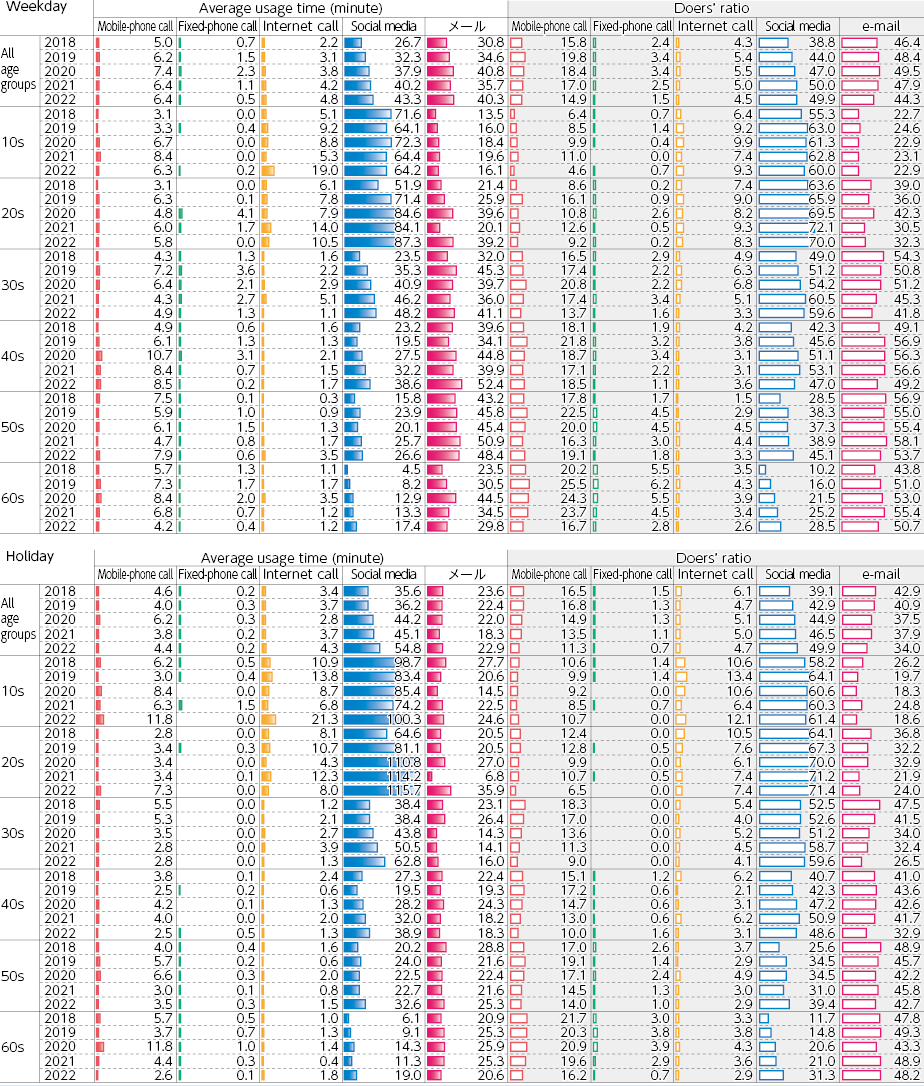
(Source) Institute for Information and Communications Policy, MIC, “FY2022 Survey on Usage Time of Information and Communication Media and Information Behavior”
- Media used by purpose (most used media; for all age groups, by age group, and by using or not using the Internet) | (Figure 4-11-1-10 in White Paper)
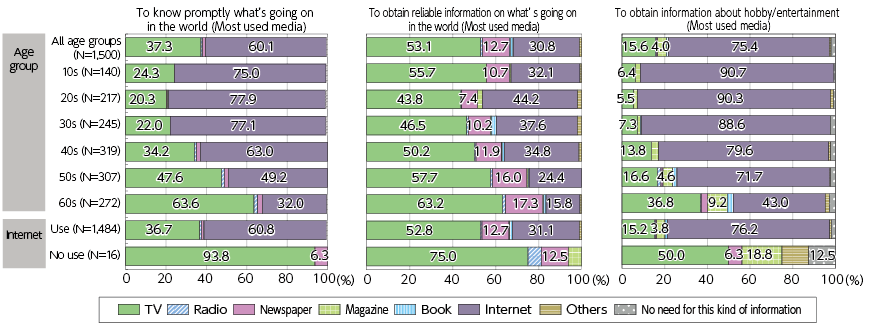
(Source) MIC Institute for Information and Communications Policy “Fiscal 2022 Survey on Information and Communications Media Usage Time and Information Behavior”
- Questionable discourse database registrations
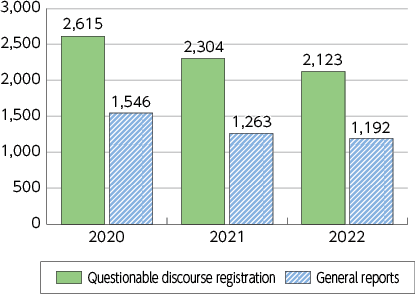
(Source) FactCheck Initiative “Questionable Discourse Database (ClaimMonitor)”
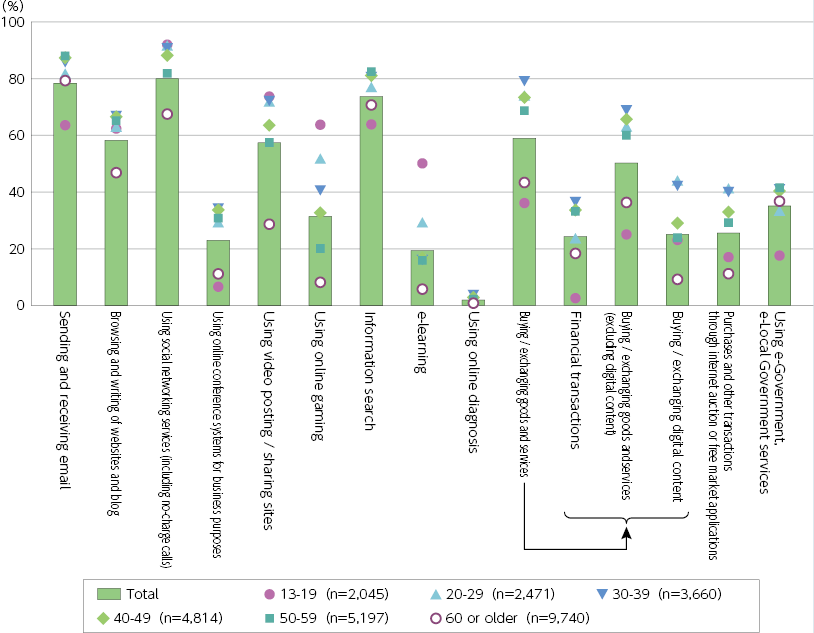
- Purpose of internet usage by age group (multiple answers) (2022)
- SNS usage state by age group
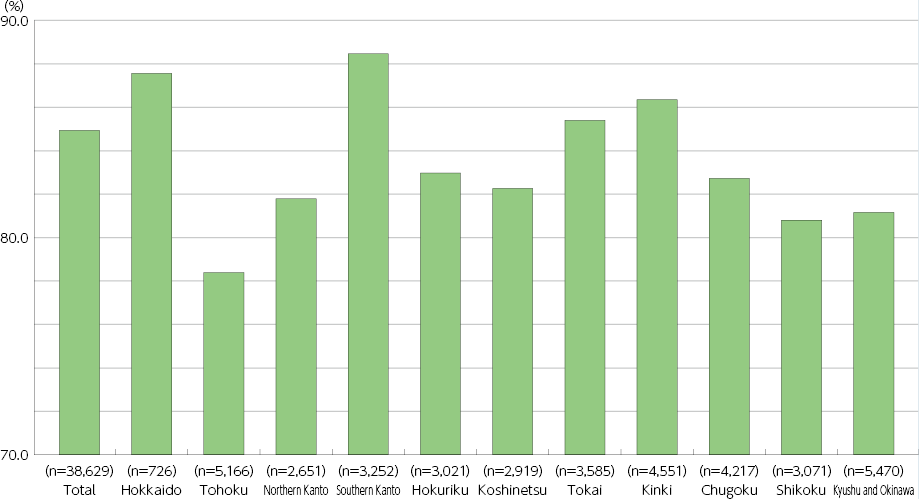
- Internet usage rate by region
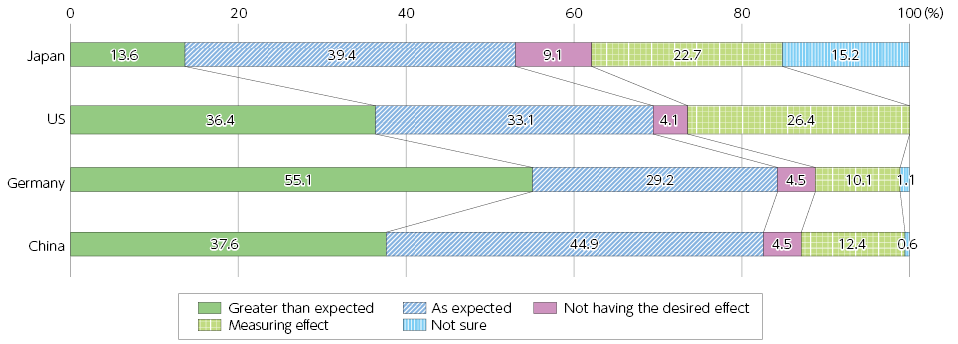
- Status of digitalization (comparison by country) | (Figure 4-11-2-1 in White Paper)
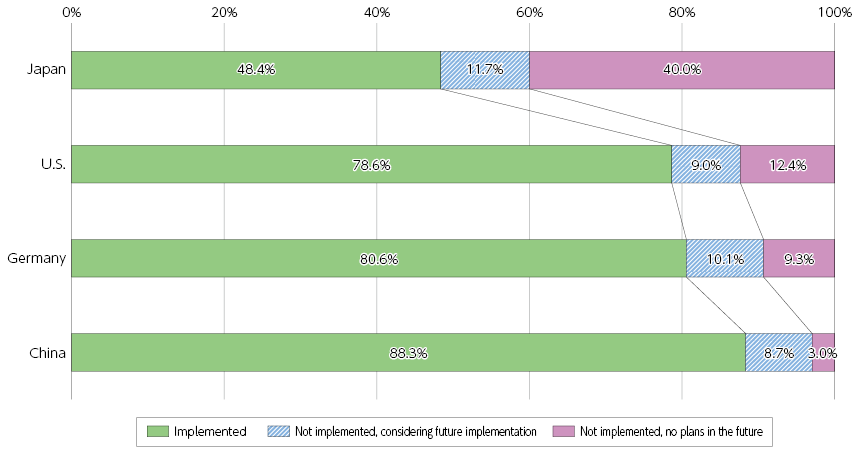
*Based on the results of a screening survey conducted to identify companies engaged in digitalization
(Source) MIC (2023) “Survey Research on R&D on the Latest Information and Communications Technologies and Trends of Use of Digital Technologies in Japan and Abroad”
- Status of digitalization (Japan: Comparison by company size)
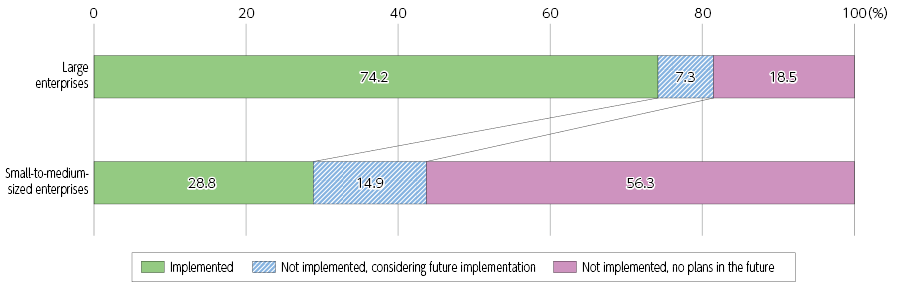
(Source) MIC (2023) “Survey Research on R&D on the Latest Information and Communications Technologies and Trends of Use of Digital Technologies in Japan and Abroad”
- Initiatives to promote digitalization (comparison by country) | (Figure 4-11-2-2 in White Paper)
(Source) MIC (2023) “Survey Research on R&D on the Latest Information and Communications Technologies and Trends of Use of Digital Technologies in Japan and Abroad”
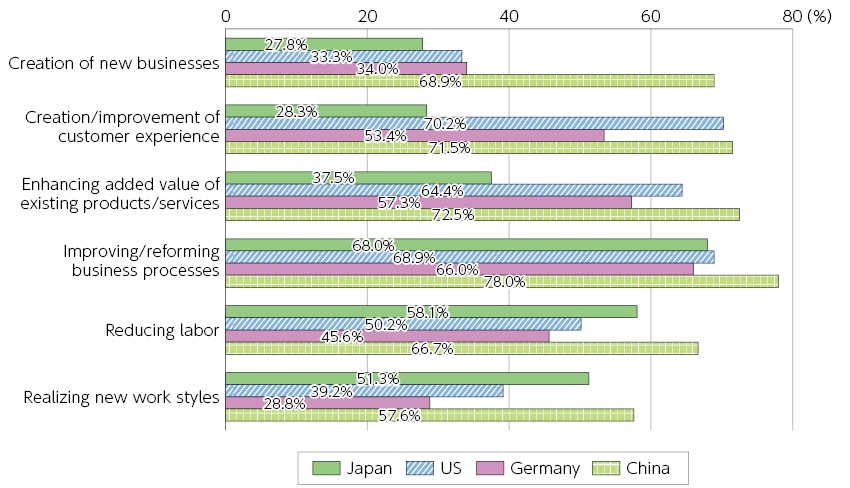
- Results of digitalization in creating new business
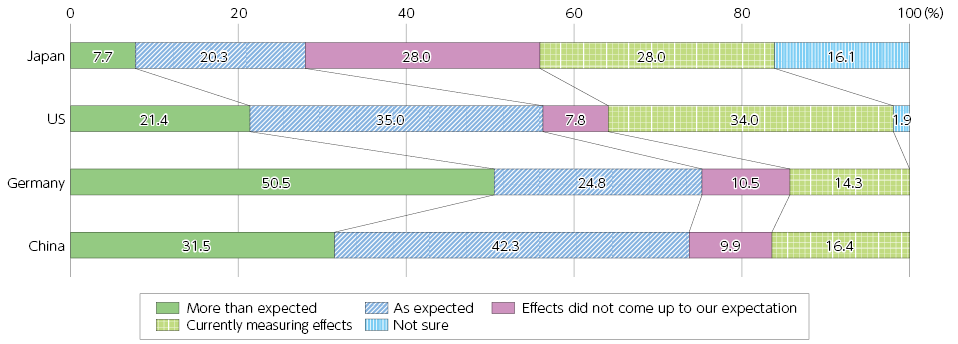
(Source) MIC (2023) "Survey Research on R&D on the Latest Information and Communications Technologies and the Trends of Use of Digital
- Results of digitalization in creating/improving customer experiences
(Source) MIC (2023) “Survey Research on R&D on the Latest Information and Communications Technologies and Trends of Use of Digital Technologies in Japan and Abroad”
- Results of digitalization in enhancing added value of existing products/services
(Source) MIC (2023) “Survey Research on R&D on the Latest Information and Communications Technologies and Trends of Use of Digital Technologies in Japan and Abroad”
- Results of digitalization in improving/reforming business processes
(Source) MIC (2023) “Survey Research on R&D on the Latest Information and Communications Technologies and Trends of Use of Digital Technologies in Japan and Abroad”
- Results of digitalization in reducing labor
(Source) MIC (2023) “Survey Research on R&D on the Latest Information and Communications Technologies and Trends of Use of Digital Technologies in Japan and Abroad”
- Results of digitalization in realizing new work styles
(Source) MIC (2023) “Survey Research on R&D on the Latest Information and Communications Technologies and Trends of Use of Digital Technologies in Japan and Abroad”
- Challenges in promoting digitalization (comparison by country) | (Figure 4-11-2-3 in White Paper)
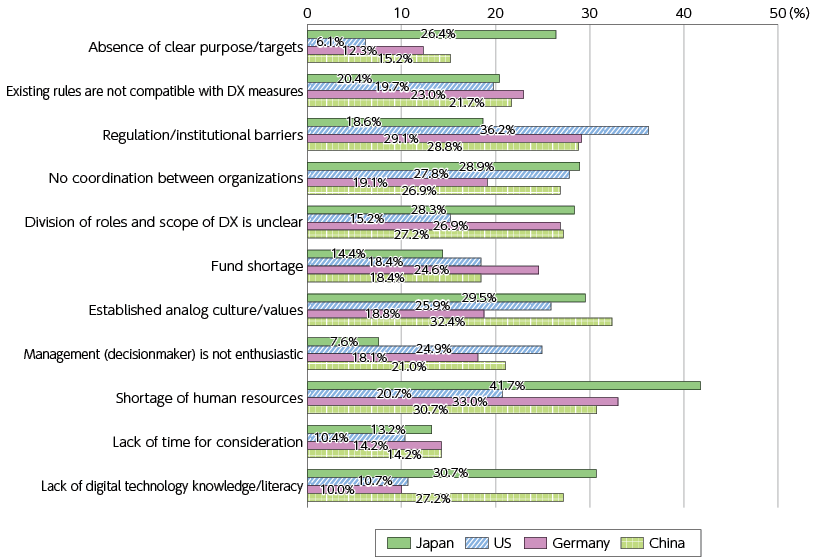
(Source) MIC (2023) “Survey Research on R&D on the Latest Information and Communications Technologies and Trends of Use of Digital Technologies in Japan and Abroad”
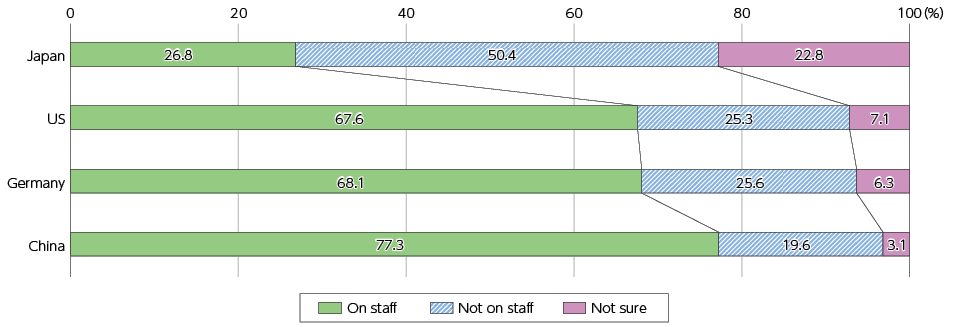
- Specialized digital human resources on staff | (Figure 4-11-2-4 in White Paper)
(Source) MIC (2023) “Survey Research on R&D on the Latest Information and Communications Technologies and Trends of Use of Digital Technologies in Japan and Abroad”
- "AI/data analysis experts" in companies making use of personal data
(Source) MIC (2023) “Survey Research on R&D on the Latest Information and Communications Technologies and Trends of Use of Digital Technologies in Japan and Abroad”
- "AI/data analysis experts" in companies making use of information other than personal data
(Source) MIC (2023) “Survey Research on R&D on the Latest Information and Communications Technologies and Trends of Use of Digital Technologies in Japan and Abroad”
- In-house development of systems (comparison by country)
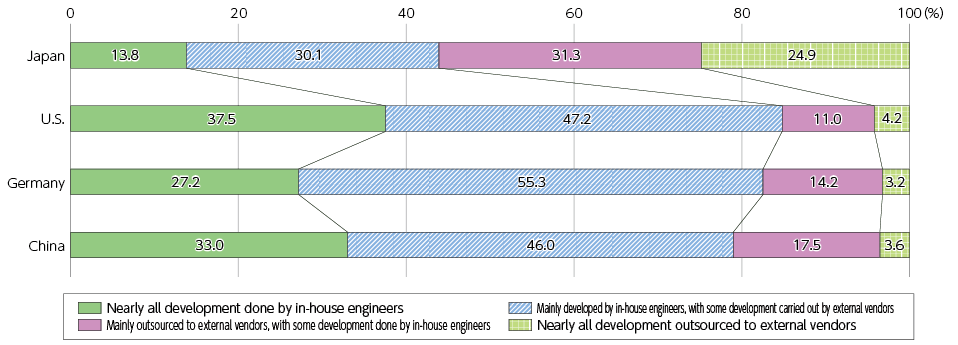
(Source) MIC (2023) “Survey Research on R&D on the Latest Information and Communications Technologies and Trends of Use of Digital Technologies in Japan and Abroad”
- Introduction of IoT, AI, and other systems and services in enterprises
- Purpose of enterprise collecting and analyzing data through IoT, AI, and other system services
- Results of introducing IoT, AI, and other systems and services in enterprises
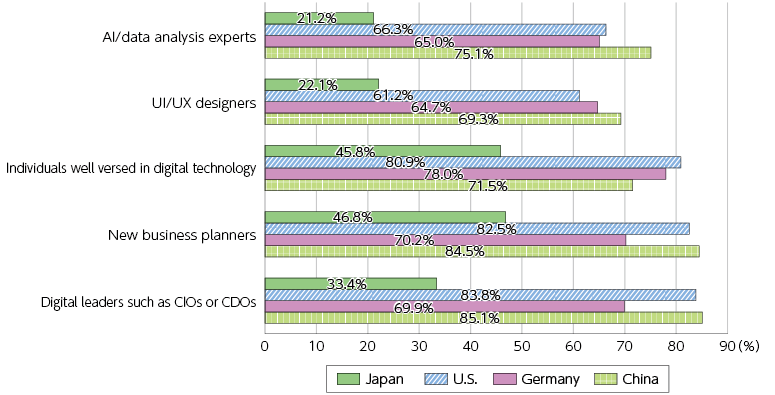
- Initiatives to secure digital human resources (by country; individuals capable of integrating digital human resources with business division personnel to build systems for DX)
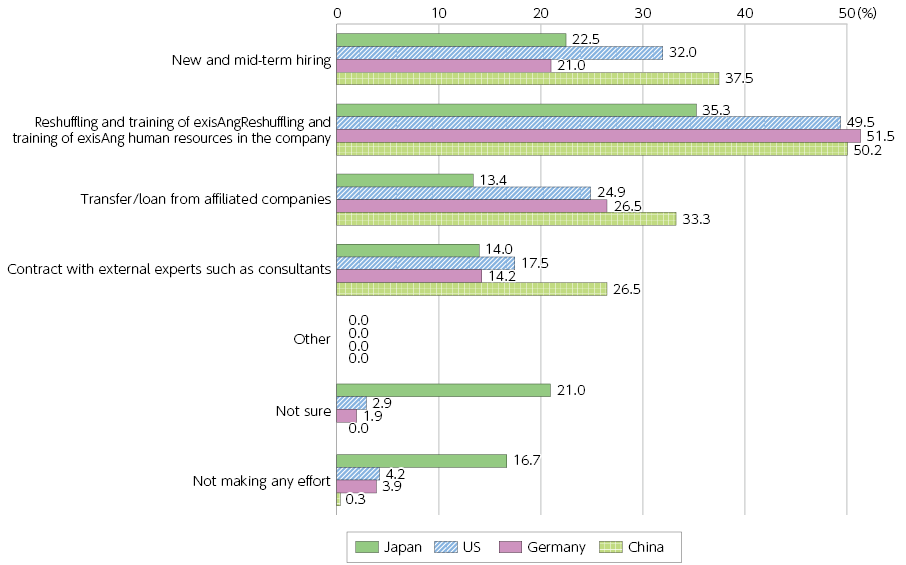
(Source) MIC (2023) “Survey Research on R&D on the Latest Information and Communications Technologies and the Trends of Use of Digital Technologies in Japan and Abroad”
- Initiatives to secure digital human resources (by country; AI/data analysis experts)
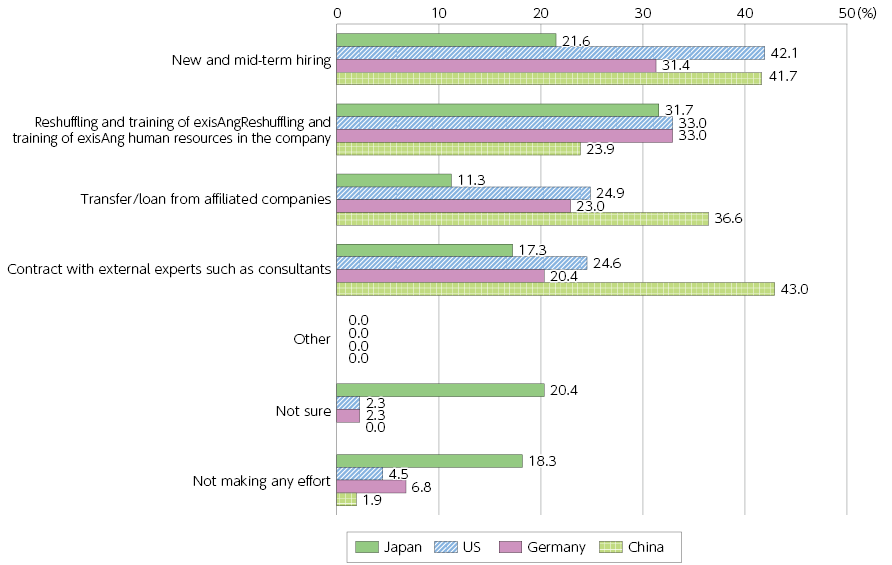
(Source) MIC (2023) “Survey Research on R&D on the Latest Information and Communications Technologies and the Trends of Use of Digital Technologies in Japan and Abroad”
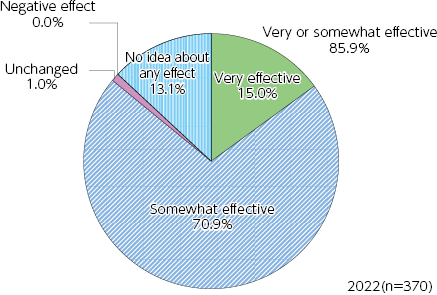
- Changes in introducing remote work | (Figure 4-11-2-5 in White Paper)
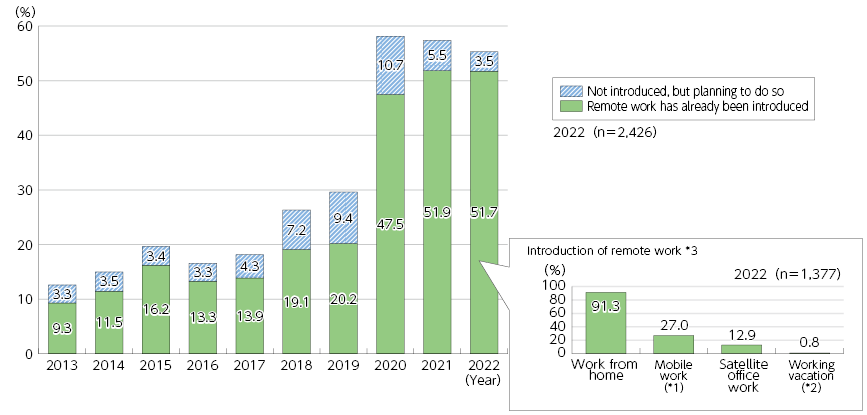
*1 Working outside of the office for sales activities and other similar work, including work such as checking email and writing daily reports during commutes or at locations such as cafes.
*2 Remote work performed in a location other than the usual workplace or the home, combined with personal time.
*3 Total includes entities that provided no response to introduction type.
(Source) MIC “Communications Usage Trend Survey”
- Purpose for introducing remote work (multiple answers allowed)
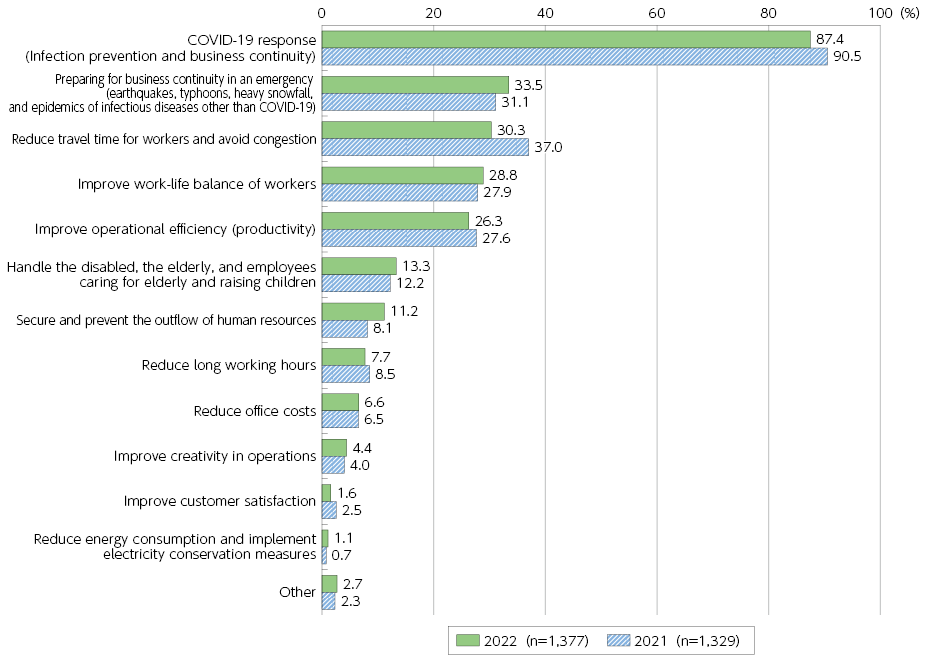
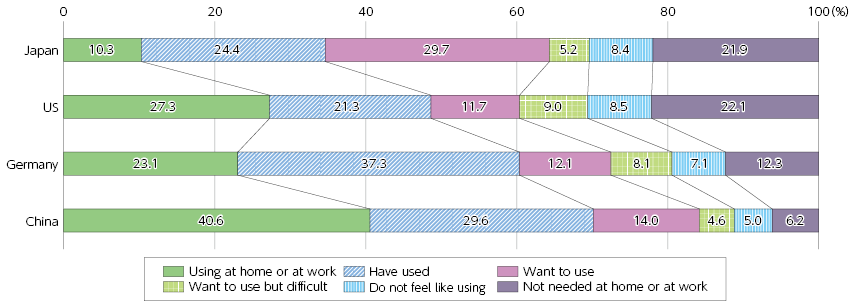
- Usage of remote work and online meetings (international comparison) | (Figure 4-11-2-6 in White Paper)
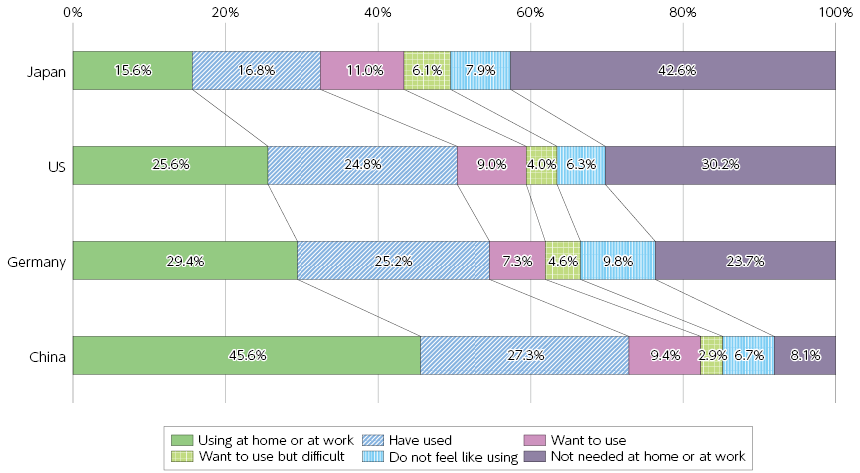
(Source) MIC (2023) “Survey Research on R&D on the Latest Information and Communications Technologies and Trends of Use of Digital Technologies in Japan and Abroad”
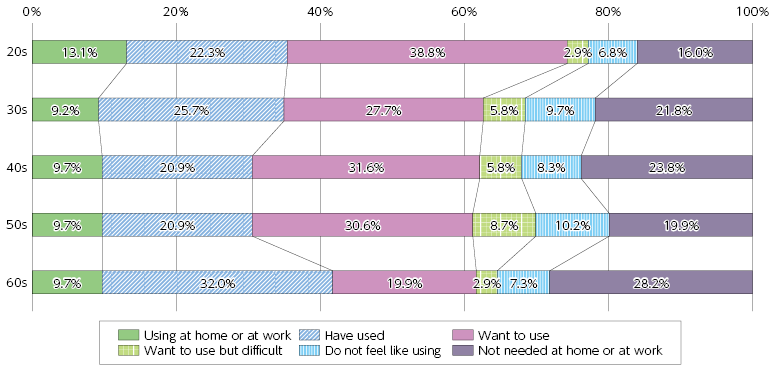
- Usage of remote work and online meetings (Japan; by age) | (Figure 4-11-2-7 in White Paper)
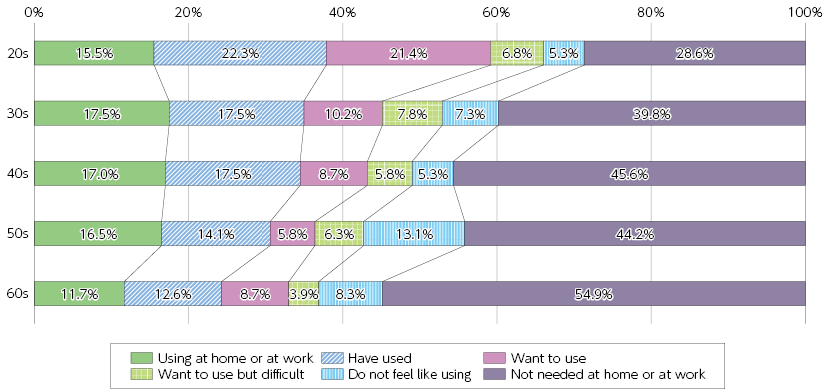
(Source) MIC (2023) “Survey Research on R&D on the Latest Information and Communications Technologies and Trends of Use of Digital Technologies in Japan and Abroad”
- Reasons why remote work or online meetings are unavailable
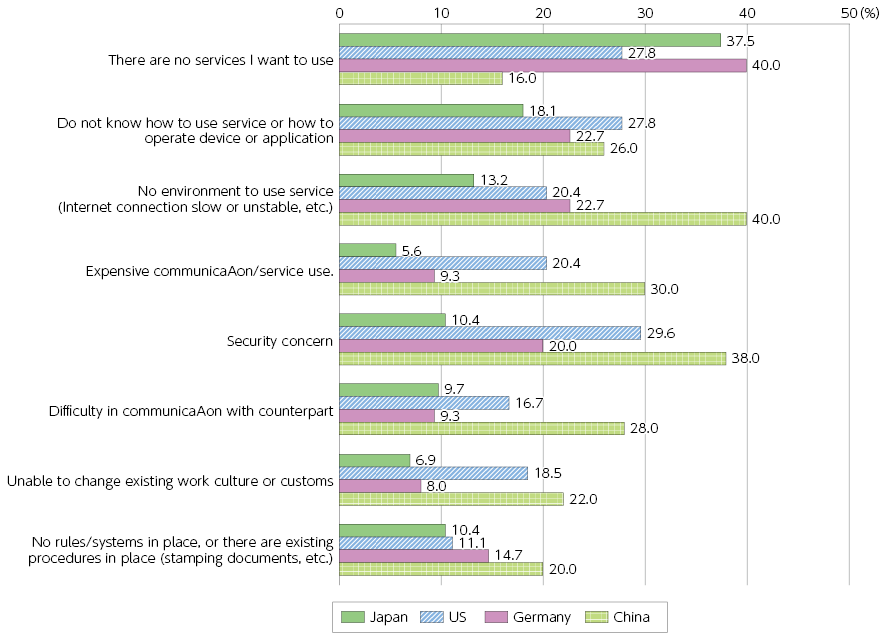
(Source) MIC (2023) “Survey Research on R&D on the Latest Information and Communications Technologies and the Trends of Use of Digital Technologies in Japan and Abroad”
- Telework usage status
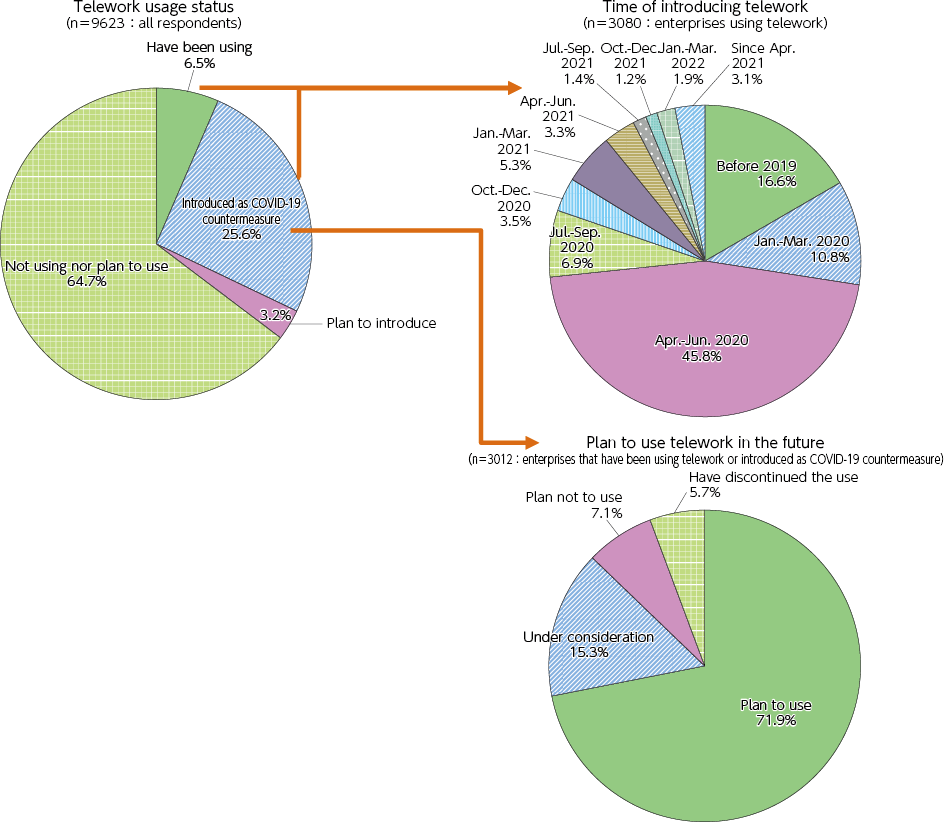
(Source) Prepared from MIC “Fiscal 2022 Result of Survey on Actual Condition of Telework Security”
- Challenges for introducing telework (multiple answers)
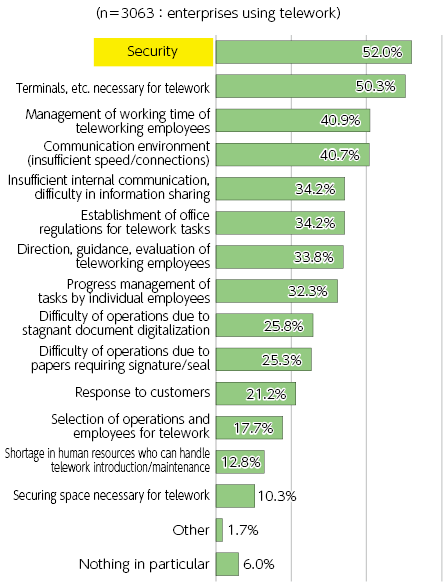
(Source) Prepared from MIC “Fiscal 2022 Result of Survey on Actual Condition of Telework Security”
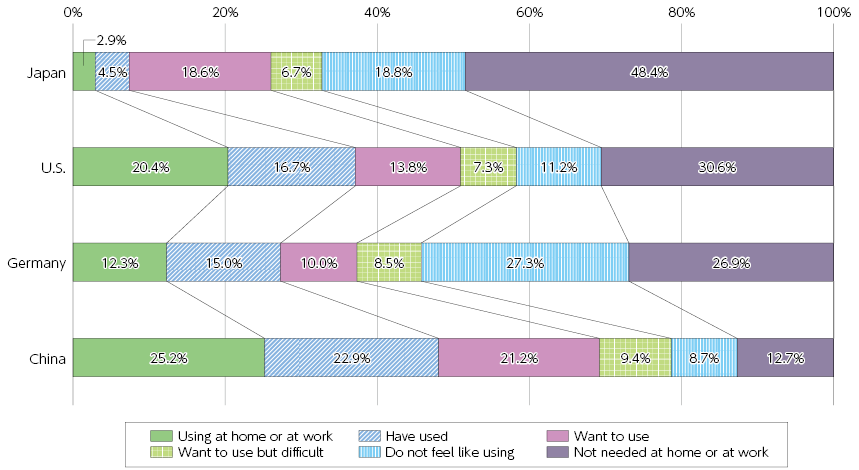
- Usage of digital administrative services (by country) | (Figure 4-11-3-1 in White Paper)
(Source) MIC (2023) “Survey Research on R&D on the Latest Information and Communications Technologies and Trends of Use of Digital Technologies in Japan and Abroad”
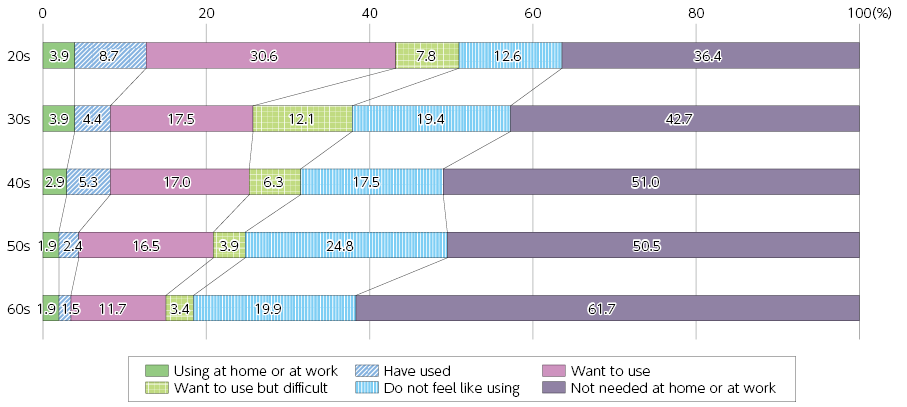
- Usage of digital administrative services (Japan; by age) | (Figure 4-11-3-2 in White Paper)
(Source) MIC (2023) “Survey Research on R&D on the Latest Information and Communications Technologies and Trends of Use of Digital Technologies in Japan and Abroad”
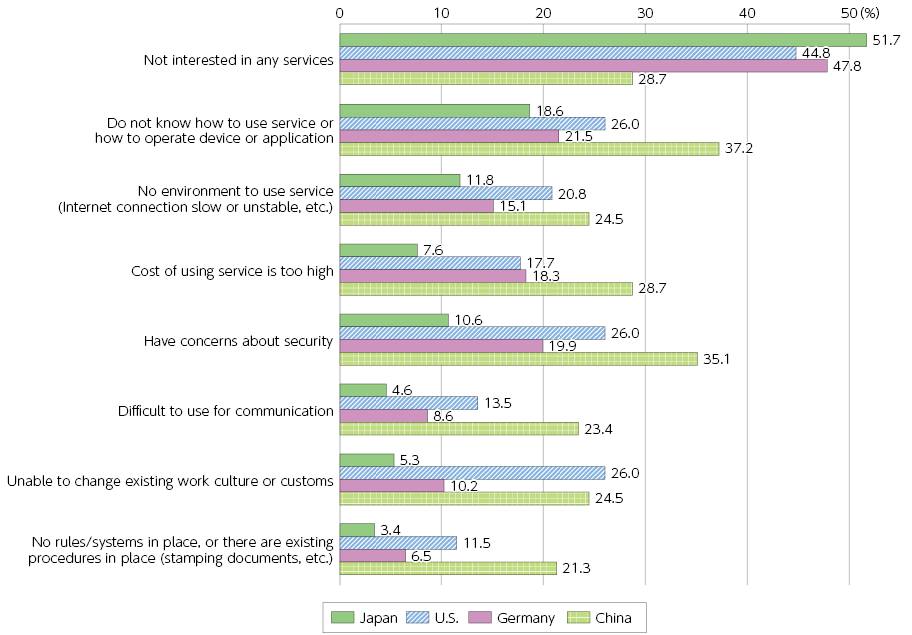
- Reason why public digital services are unavailable (by country)
(Source) MIC (2023) “Survey Research on R&D on the Latest Information and Communications Technologies and the Trends of Use of Digital Technologies in Japan and Abroad”
- Changes in Japan's ranking in the UN (UNDESA) “World E-Government Ranking” | (Figure 4-11-3-3 in White Paper)
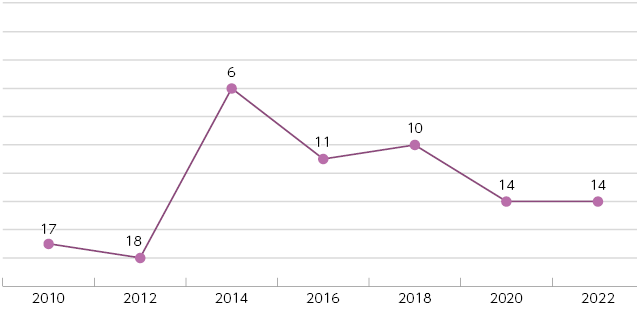
(Source) Changes in Japan's individual indicator scores in the UN (UNDESA) “World E-Government Ranking” (data collection)
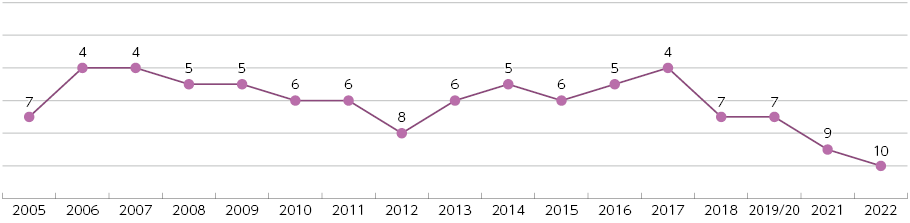
- Changes to Japan's ranking in Waseda University's "World Digital Government Rankings"
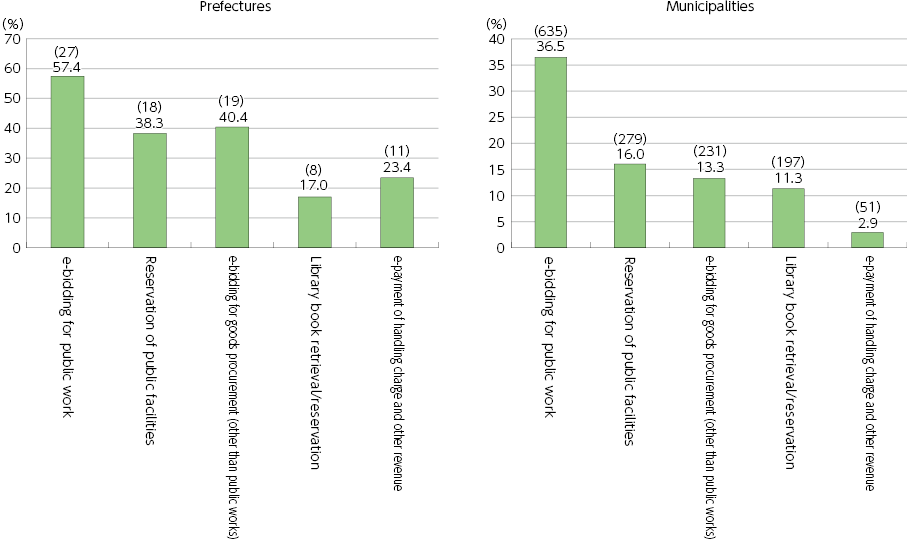
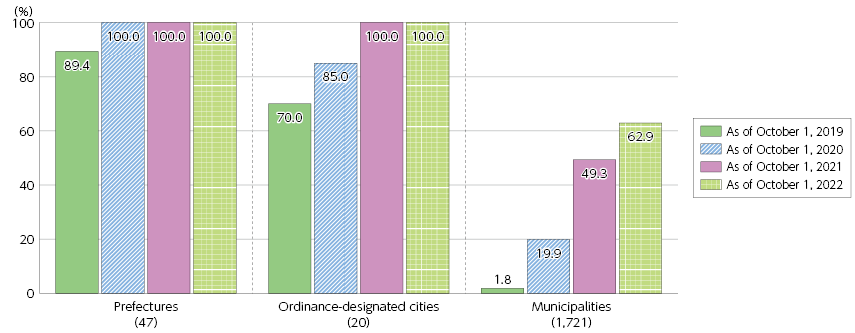
- Changes in online usage of 59 procedures local governments must prioritize taking online | (Figure 4-11-3-4 in White Paper)
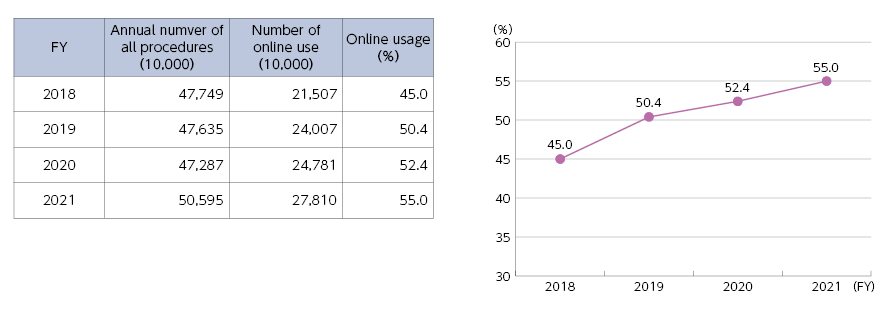
*1 Online usage for fiscal 2020 and fiscal 2019 was calculated based on a resurvey of the 59 procedures that local governments should prioritize in taking procedures online as listed in the “Priority Policy Program for Realizing Digital Society” (approved by the Cabinet on June 7, 2022).
*2 Online usage rate (%) = Number of procedures used online / Total number of procedures per year × 100
*The total number of procedures per year is a national estimate based on the total number of procedures and the population of organizations that have already gone online for these procedures.
*The number of procedures used online is estimated in the same way as the total number of procedures per year, in order to more precisely calculate online usage.
(Source) Based on MIC “Overview of Promotion of DX and Use of Information by Local Governments: Summary of Fiscal 2022 Survey on Promotion of Use of Administrative Information by Local Governments”
- Joint use of various online systems (as of April 1, 2022)
(Source) Based on MIC "Overview of Promotion of DX and Use of Information by Local Governments: Summary of Fiscal 2022 Survey on Promotion of Use of Administrative Information by Local Governments"
https://www.soumu.go.jp/denshijiti/060213_02.html- Individual Number Card delivery rate
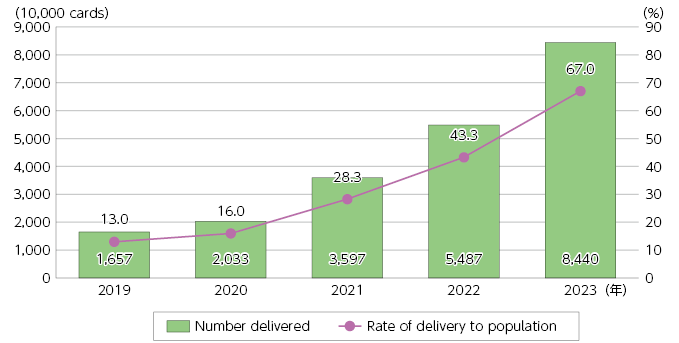
*Number of tickets issued as of April 1 each year (as of March 31 for 2023)
(Source) Prepared from MIC, “issuance status of Individual Number Card”
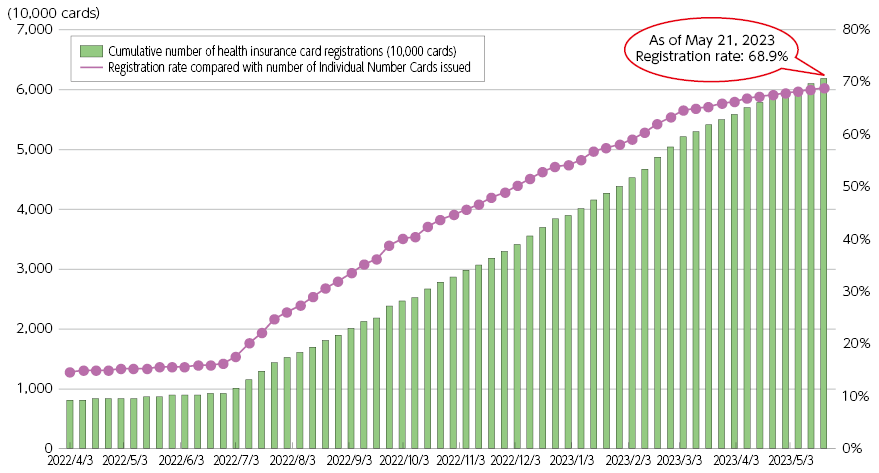
- Changes in registrations of Individual Number Cards for use as health insurance cards
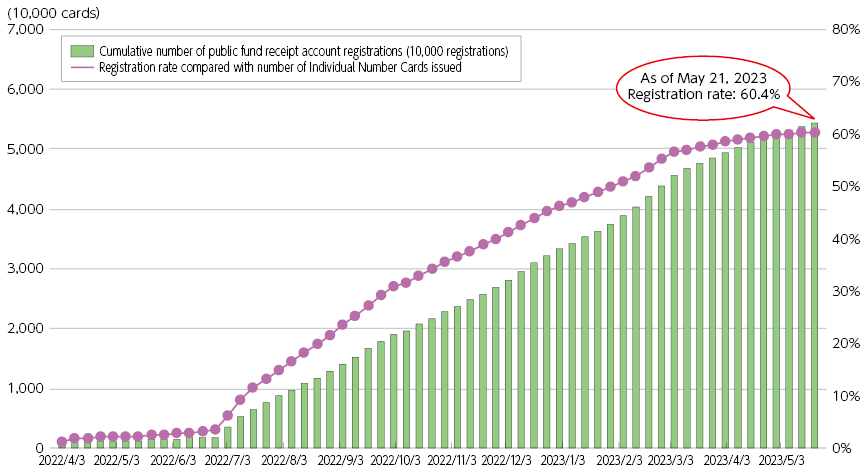
- Changes in public fund receipt account registrations
- Introduction of AI in local governments | (Figure 4-11-3-5 in White Paper)
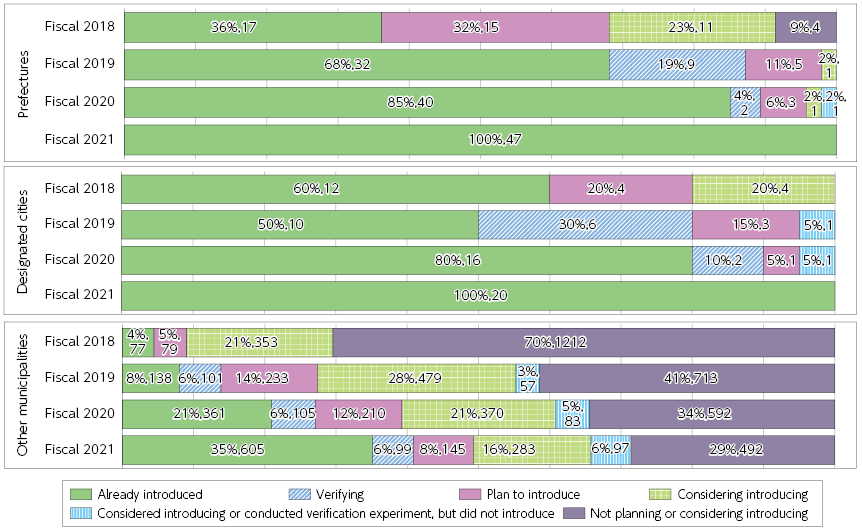
(Source) MIC “Promotion of AI/RPA Usage by Local Governments” (June 27, 2022)
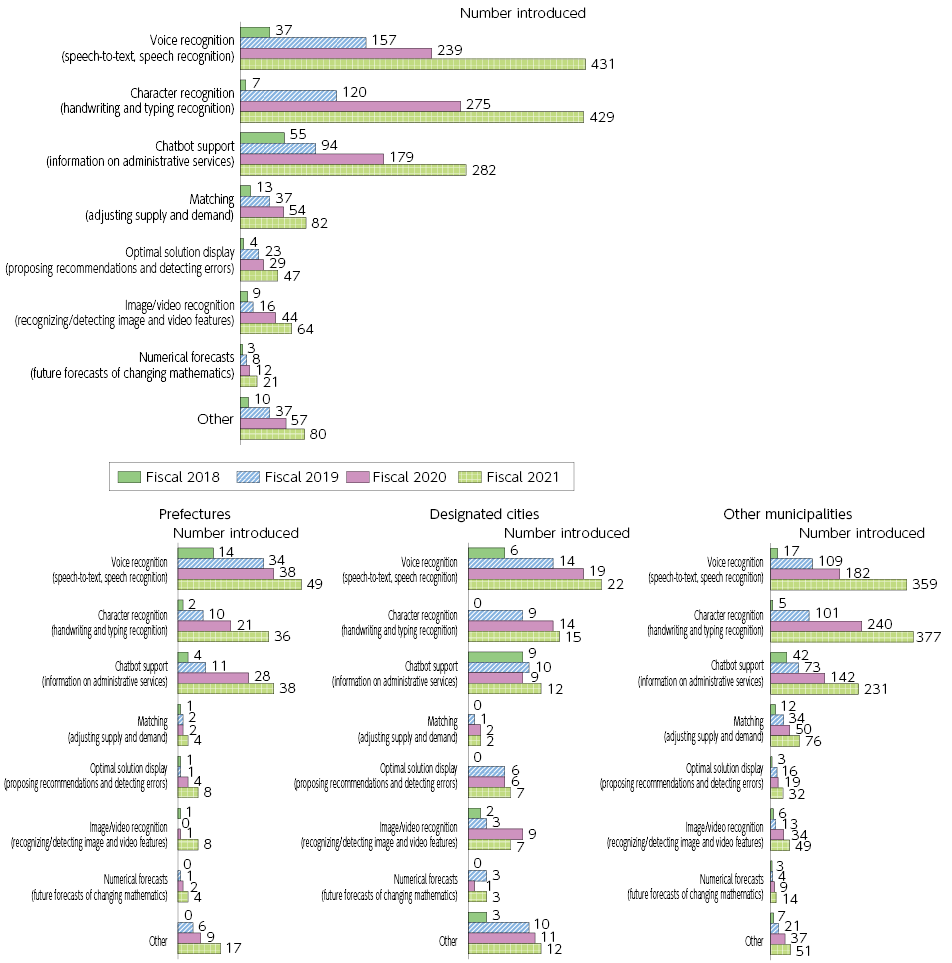
- Status of Introduction of AI in local governments (introduction by AI function)
- Status of Introduction of RPA in local governments | (Figure 4-11-3-6 in White Paper)
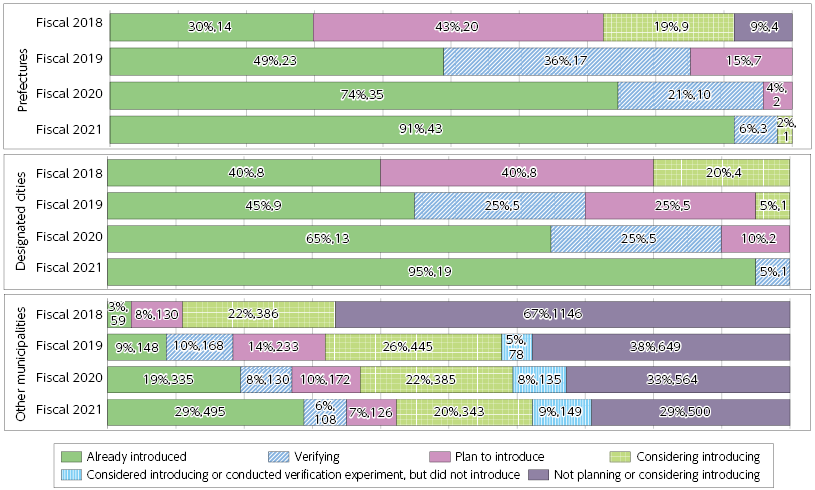
(Source) MIC “Promotion of AI/RPA Usage by Local Governments” (June 27, 2022)
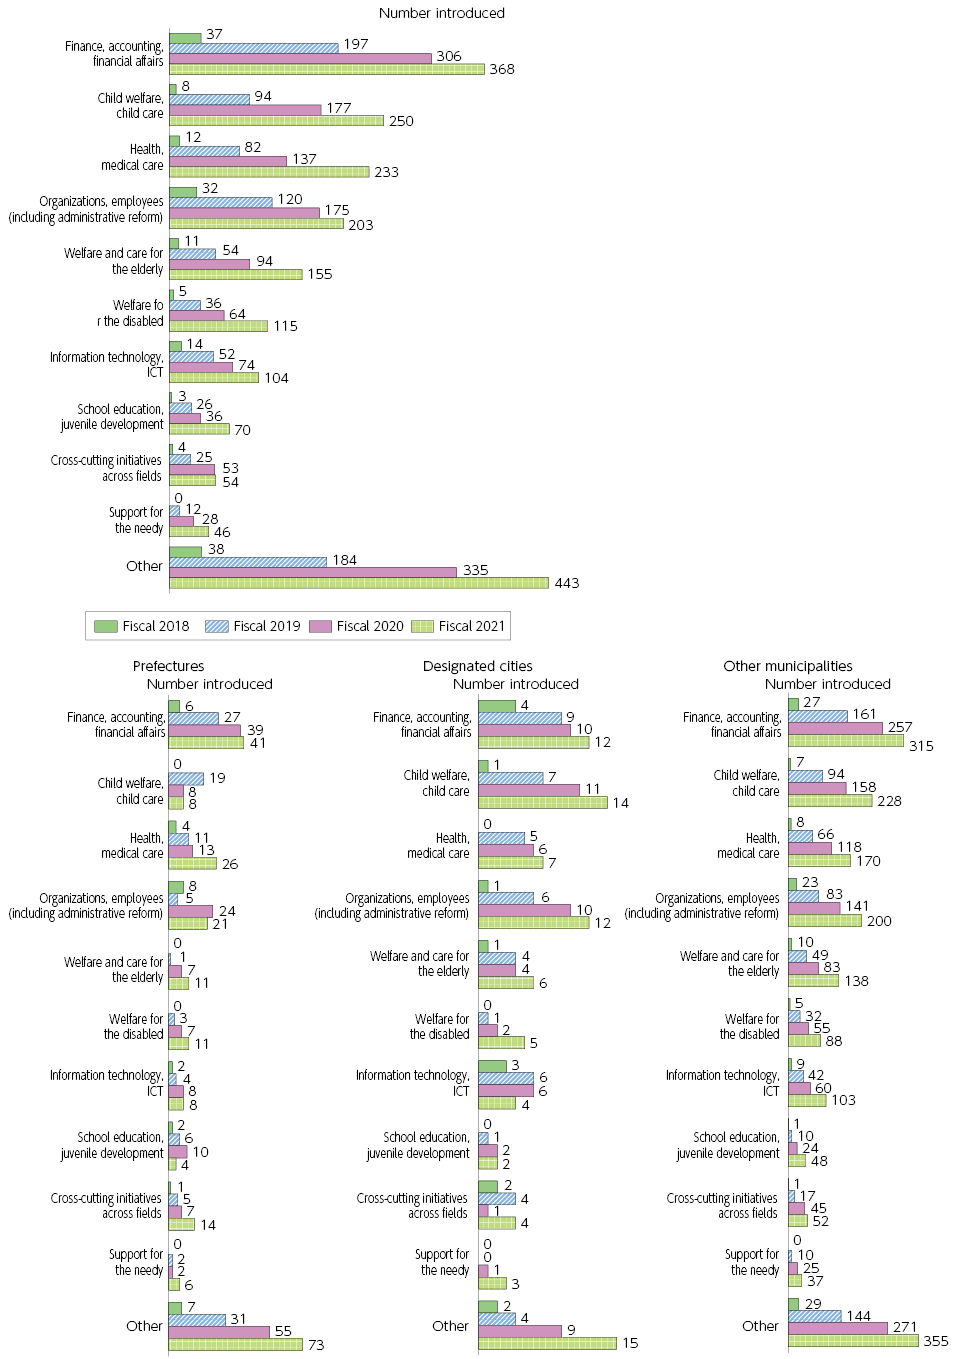
- Status of Introduction of RPA in local governments (status of introduction by RPA field)
- Status of introducing remote work by employees | (Figure 4-11-3-7 in White Paper)
(Source) Based on MIC “Survey on Remote Work Initiatives by Local Governments”
Chapter 4 - Section 12
- Japan Post Group organization chart | (Figure 4-12-1-1 in White Paper)
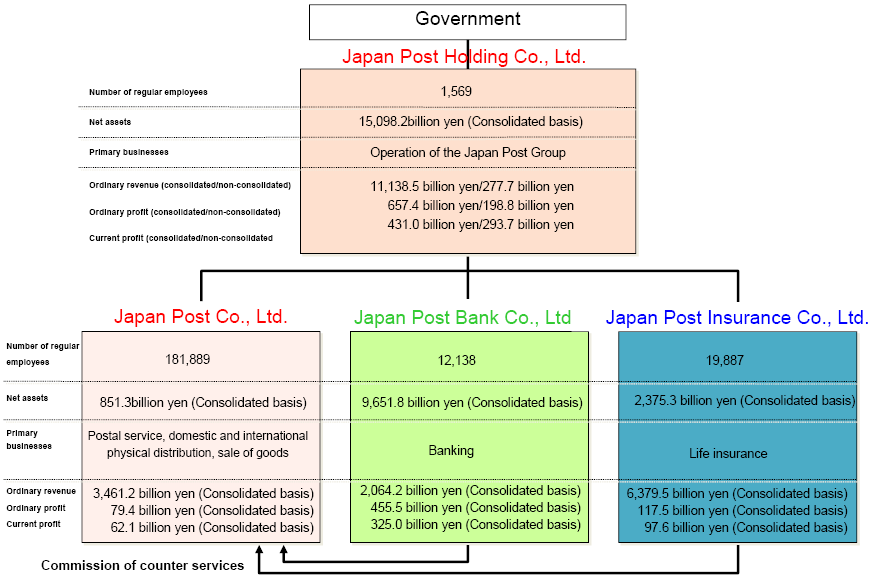
*1 Number of employees (regular employees) as of September 30, 2022.
*2 The “current net profit” of each company is the current net profit attributable to parent company shareholders.
(Source) Based on financial results for the period ending March 2023 and disclosure reports (2022)
- Japan Post Group management | (Figure 4-12-1-2 in White Paper)
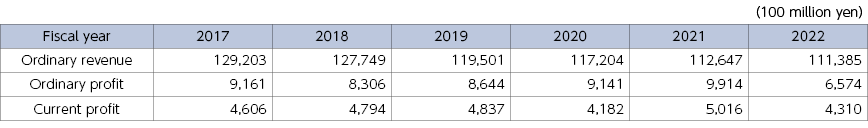
(Source) Based on Japan Post Holdings Co., Ltd. “Overview of Financial Results”
- Changes in Japan Post's (consolidated) operating profit and loss | (Figure 4-12-1-3 in White Paper)
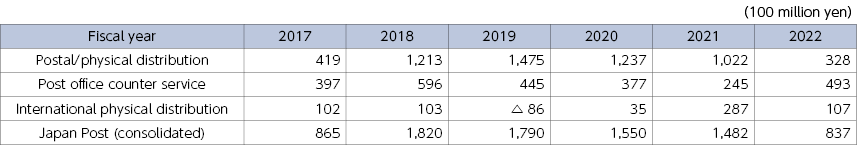
*The segment name was changed from “financial counter service” to “post office counter service” during the March 2022 term.
(Source) Based on Japan Post Holdings Co., Ltd. “Overview of Financial Results”
- Postal service income and expenditures

*Balance of the postal service of Japan Post Co., Ltd.
(Source) Based on Japan Post Co., Ltd. “Postal Service Income and Expenditures”
- Changes in the number of facilities related to postal services | (Figure 4-12-1-4 in White Paper)
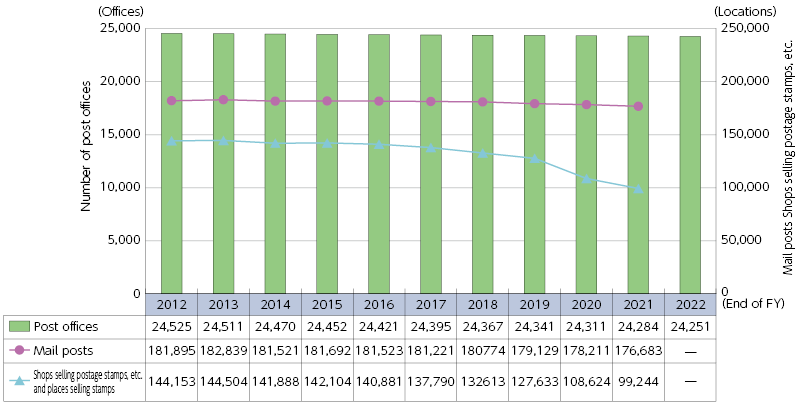
(Source) "Japan Post Group Disclosure Report"
*Based on Japan Post “Information on the number of postal offices (open data)” website
- Breakdown of the number of post offices (end of fiscal 2022)
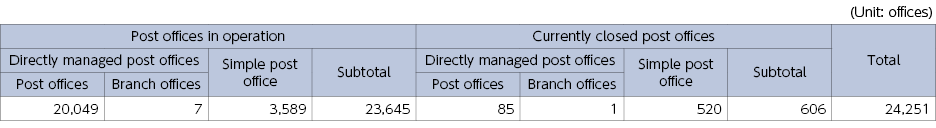
*“Simple post office” refers to post offices operating based on a contract.
*“Currently closed post office” refers to post offices temporarily closed and suspending counter services.
*28 of the 86 “directly managed post offices” of “currently closed post offices” are temporarily closed due to the impact of the Great East Japan Earthquake.
*10 of the 520 “simple post offices” of “currently closed post offices” are temporarily closed due to the impact of the Great East Japan Earthquake.
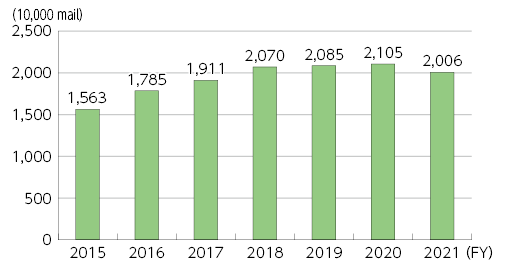
- Changes in the total number of postal items accepted | (Figure 4-12-1-5 in White Paper)
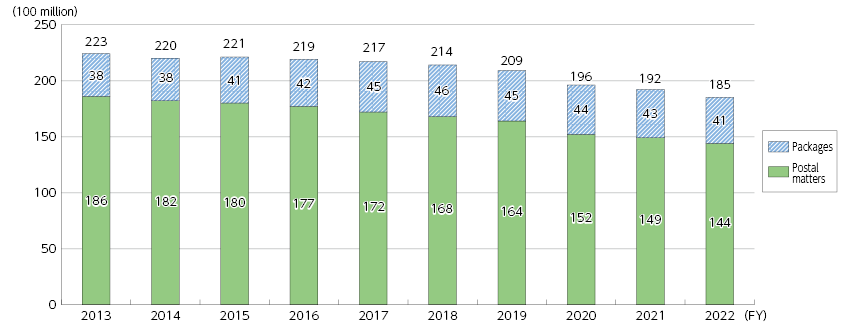
*Following the privatization of postal services, Yu-Pack and Yu-Mail are now provided as packages as defined by the Trucking Business Act, and not as parcels as defined by the Postal Act.
(Source) Based on Japan Post “Number of Postal Items Accepted” material released each fiscal year
- Changes in the balance of deposits of Japan Post Bank | (Figure 4-12-1-6 in White Paper)
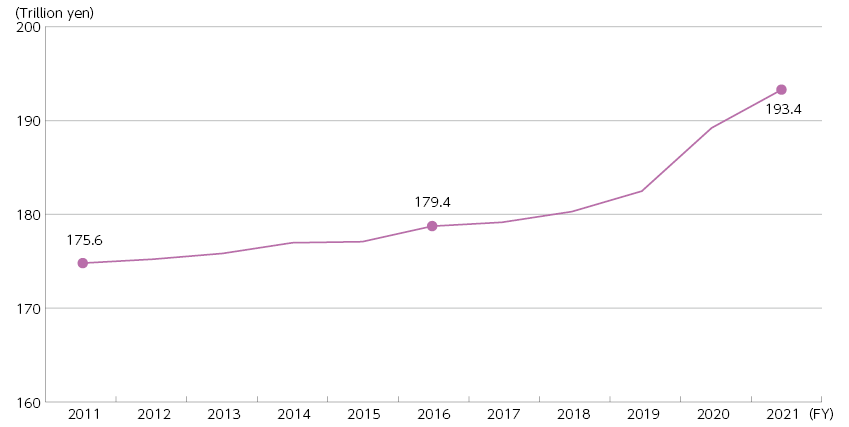
*The figure is the sum of savings before and after postal service privatization.
(Source) Based on Japan Post Bank Securities Report
- Changes in the number of insurance contracts and annualized premiums for Japan Post Insurance | (Figure 4-12-1-7 in White Paper)
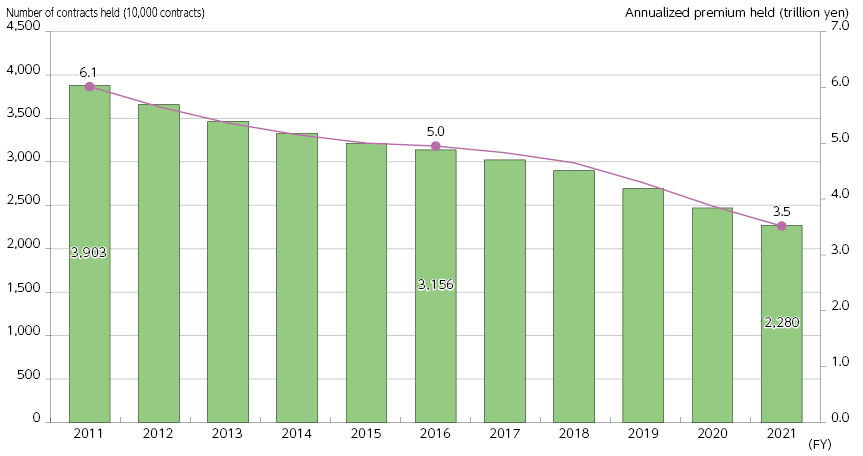
(Source) Based on Japan Post Insurance Securities Report
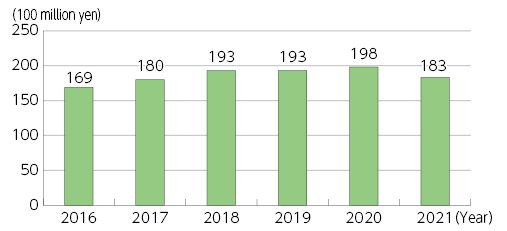
- Changes in correspondence delivery service operator sales | (Figure 4-12-2-1 in White Paper)
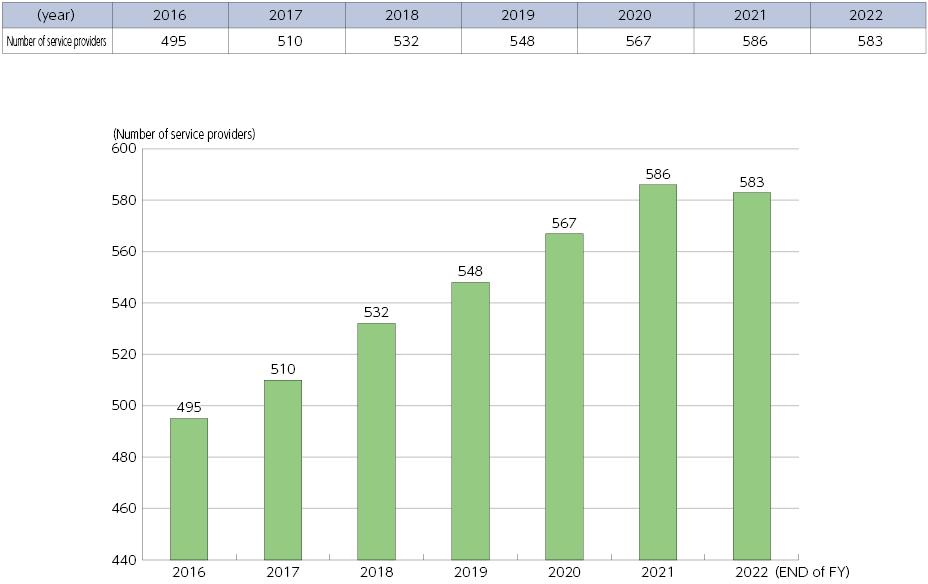
- Changes in the number of specified correspondence delivery service providers
- Changes in the number of business operators by type of service (specified correspondence delivery service)
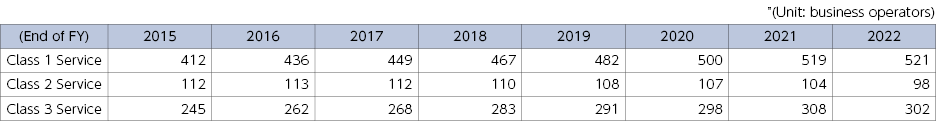
*The numbers do not agree with the number of the businesses who entered the market because some of them provide more than two types of services.
• Class 1 Service: delivery of correspondence mail whose sum of the length, width and height is over 73cm or whose weight is over 4kg
• Class 2 Service: delivery of correspondence mail within 3 hours from the time of its receipt
• Class 3 Service: delivery of correspondence mail the postage of which exceed 800 yen in Japan
- Changes in the number of correspondences accepted
Policy Focus 1
- Direction Japan must take toward the coming future of 2030 | (Figure 1 in White Paper)
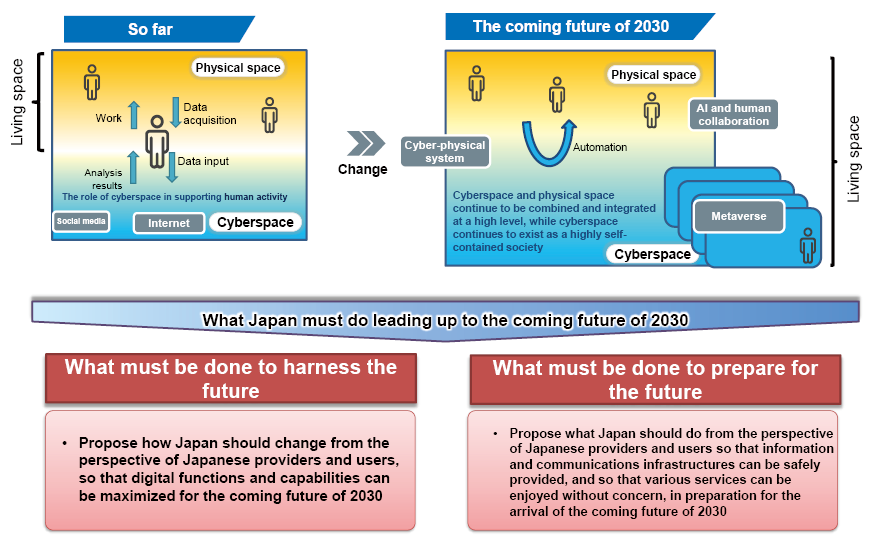
- Coming future of 2030
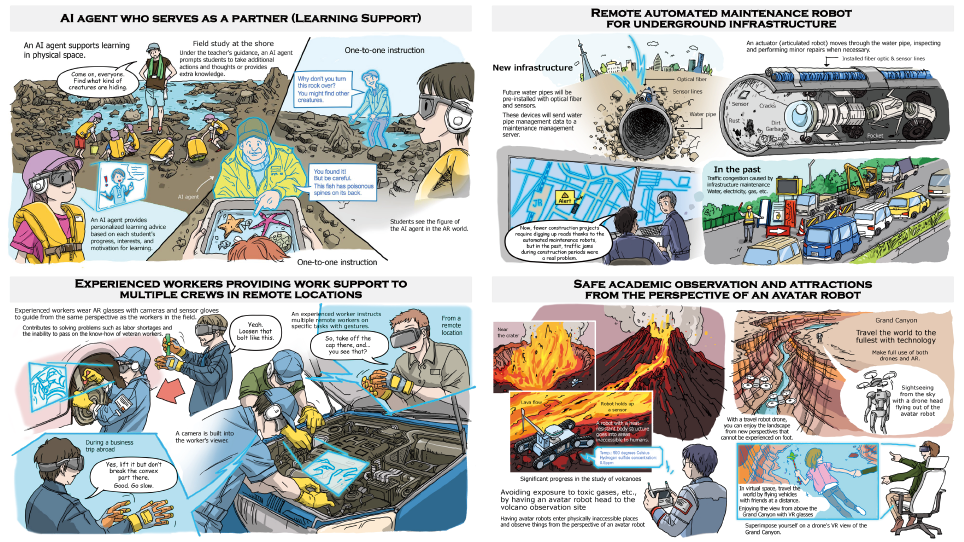
(Source) Final report on “Information and Communications Policy with a View to 2030”
- Overview of the final report on “Information and Communications Policy with a View to 2030”
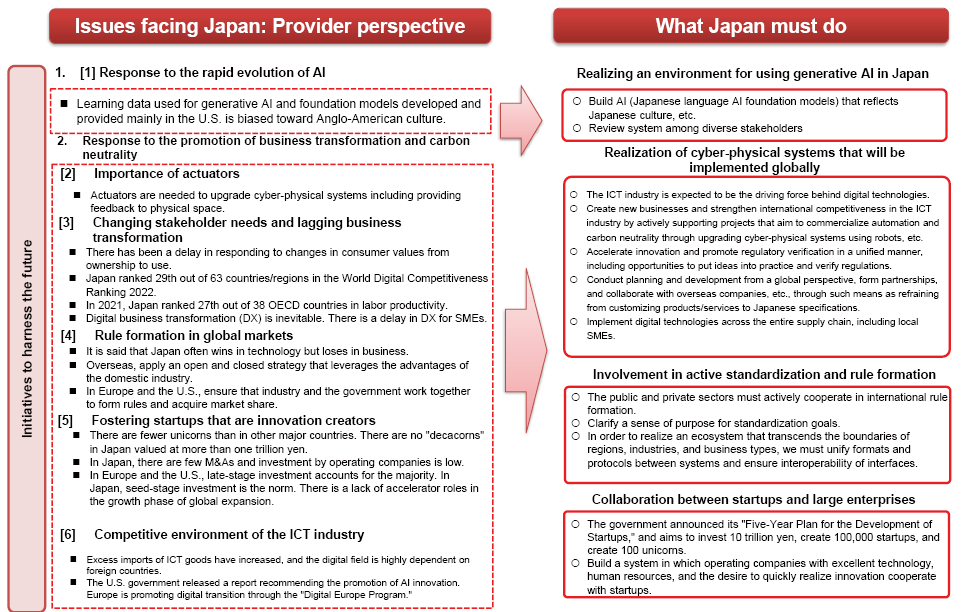
(Source) Final report on “Information and Communications Policy with a View to 2030”
- Overview of the final report on “Information and Communications Policy with a View to 2030”
(Source) Final report on “Information and Communications Policy with a View to 2030”
- Overview of the final report on “Information and Communications Policy with a View to 2030”
(Source) Final report on “Information and Communications Policy with a View to 2030”
Chapter 5 - Section 2
- “#NoHeartNoSNS (no social media without heart!)” related content | (Figure 5-2-5-1 in White Paper)

*Left: "#NoHeartNoSNS (no social media without heart!) logo
*Right: “Eagle Talon #NoHeartNoSNS Operation” main visual
- Filtering and anti-piracy videos for young people | (Figure 5-2-5-2 in White Paper)

Chapter 5 - Section 3
- 5G features | (Figure 5-3-3-1 in White Paper)
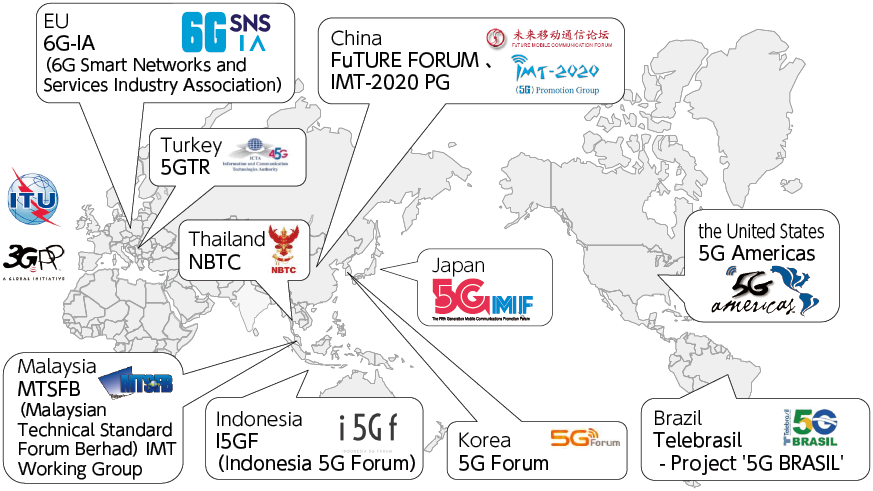
- Organizations promoting 5G in each country/region | (Figure 5-3-3-2 in White Paper)
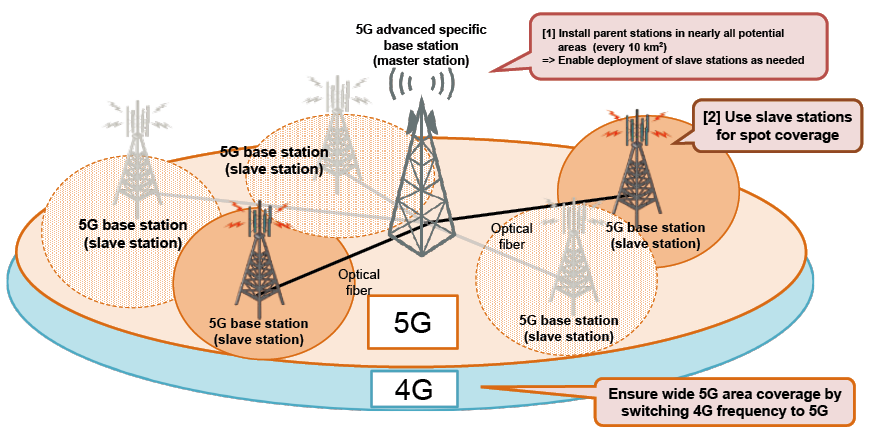
- 5G development | (Figure 5-3-3-3 in White Paper)
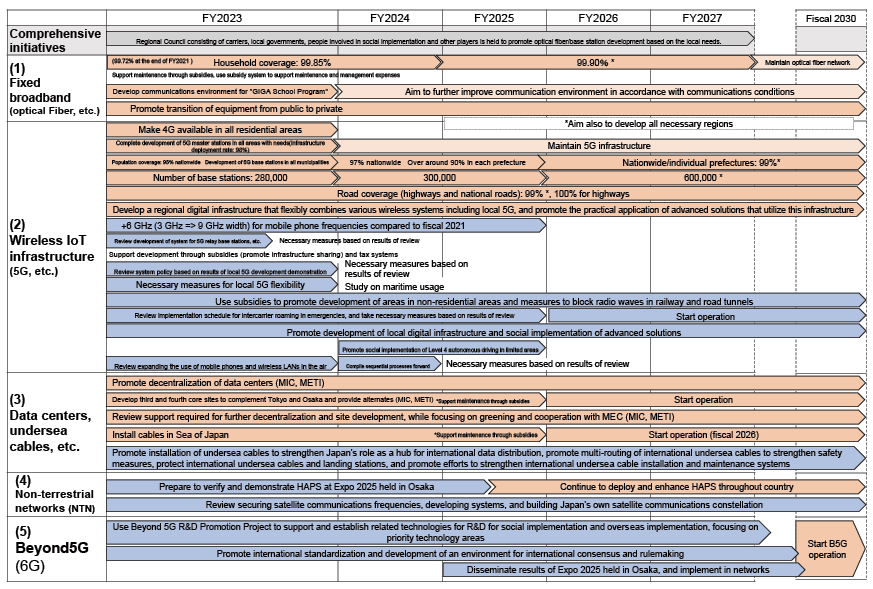
- Development of Digital Garden City Nation infrastructure (roadmap) | (Figure 5-3-3-4 in White Paper)
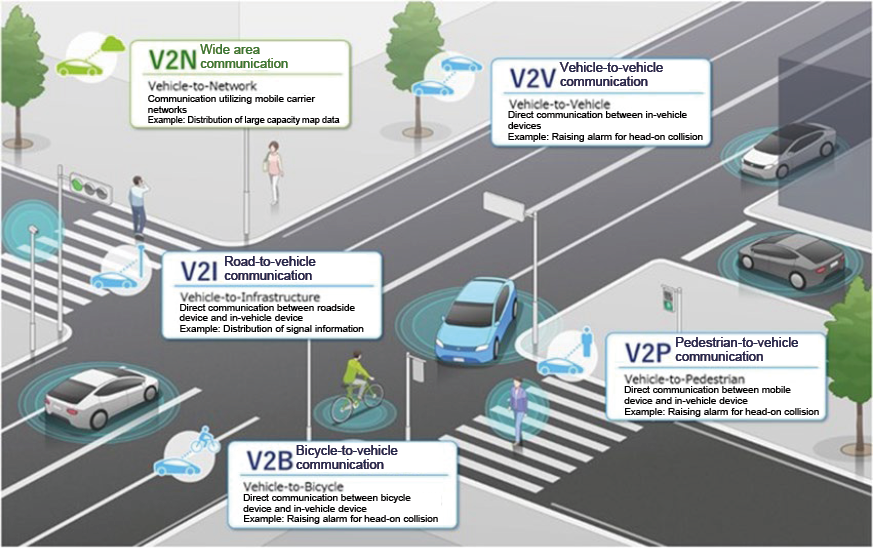
- V2X communication | (Figure 5-3-4-1 in White Paper)
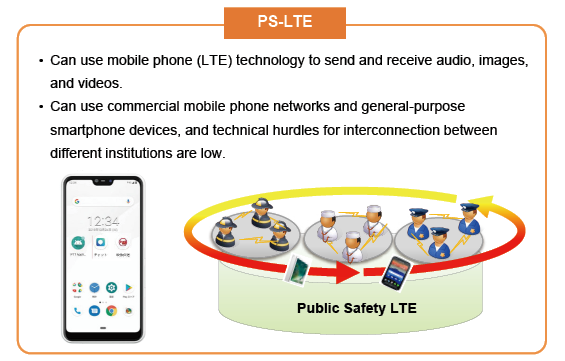
- Implementation of Public Safety LTE | (Figure 5-3-4-2 in White Paper)
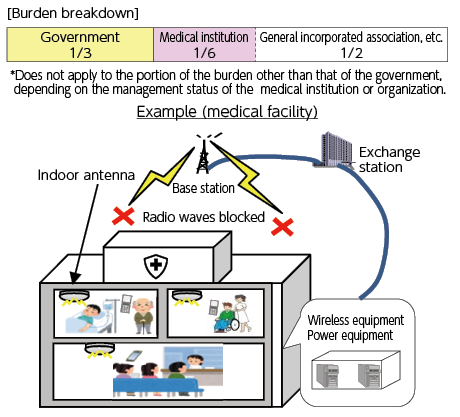
- Project to block radio waves in medical facilities | (Figure 5-3-6-1 in White Paper)
Chapter 5 - Section 4
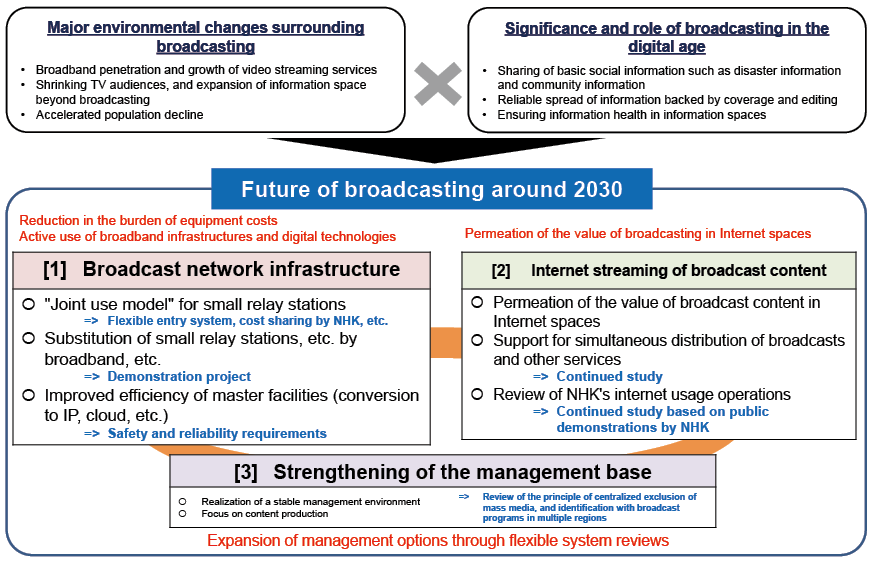
- Overview of report by the “Study Group on the Ideal Broadcasting System in the Digital Age” (published on August 5, 2022) | (Figure 5-4-2-1 in White Paper)
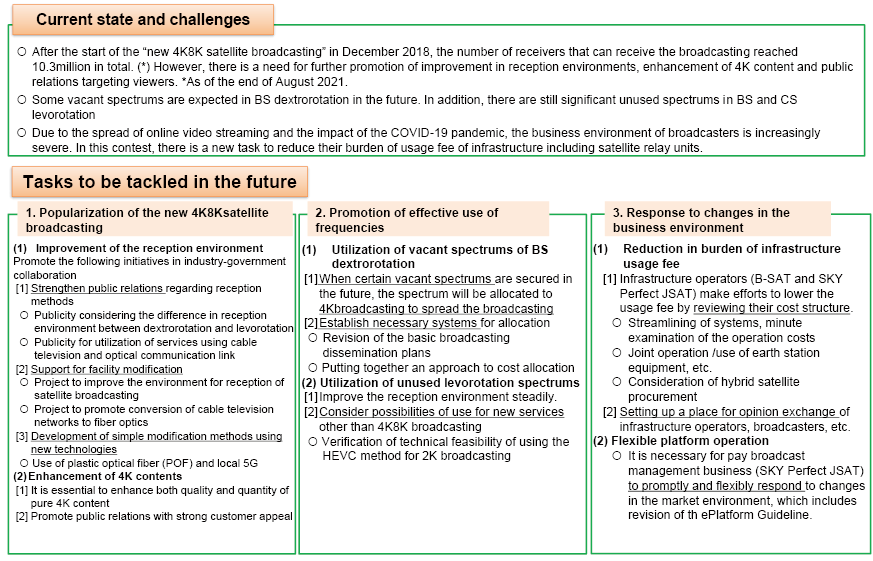
- Summary of the report by the Working Group on the Future Image of Satellite Broadcasting | (Figure 5-4-4-1 in White Paper)
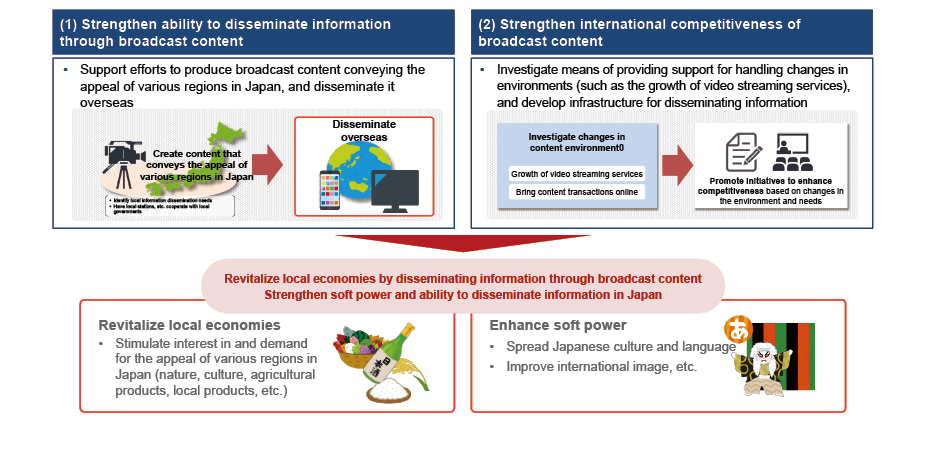
- Promotion of the overseas expansion of broadcast content | (Figure 5-4-5-1 in White Paper)
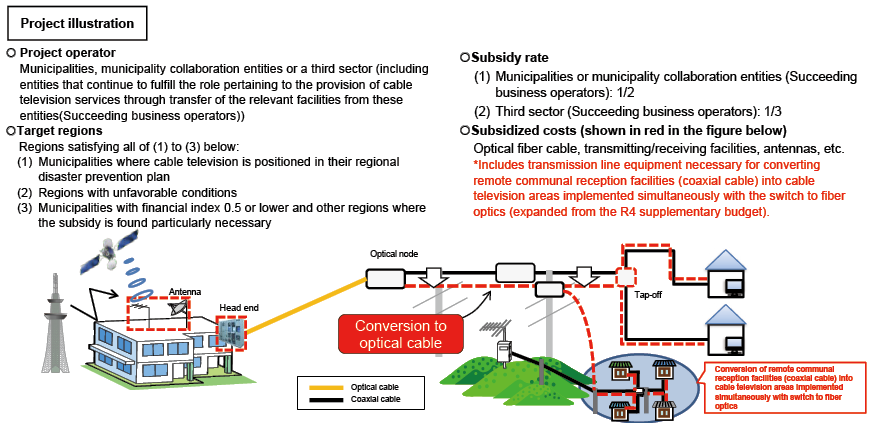
- “Project to enhance the disaster resistance through conversion of cable televisions to fiber optics toward establishment of 'New Normal'” | (Figure 5-4-7-1 in White Paper)
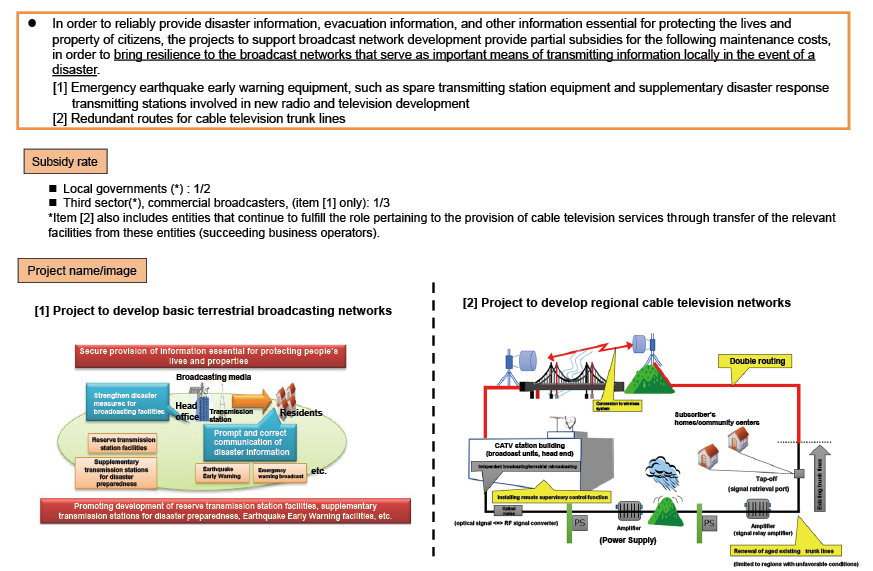
- Projects to support broadcast network development | (Figure 5-4-7-2 in White Paper)
Chapter 5 - Section 5
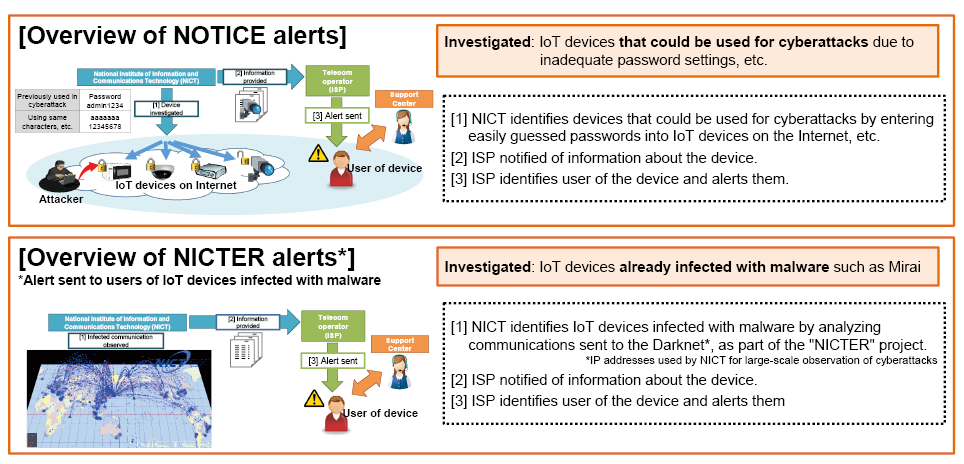
- Overview of NOTICE and NICTER alerts
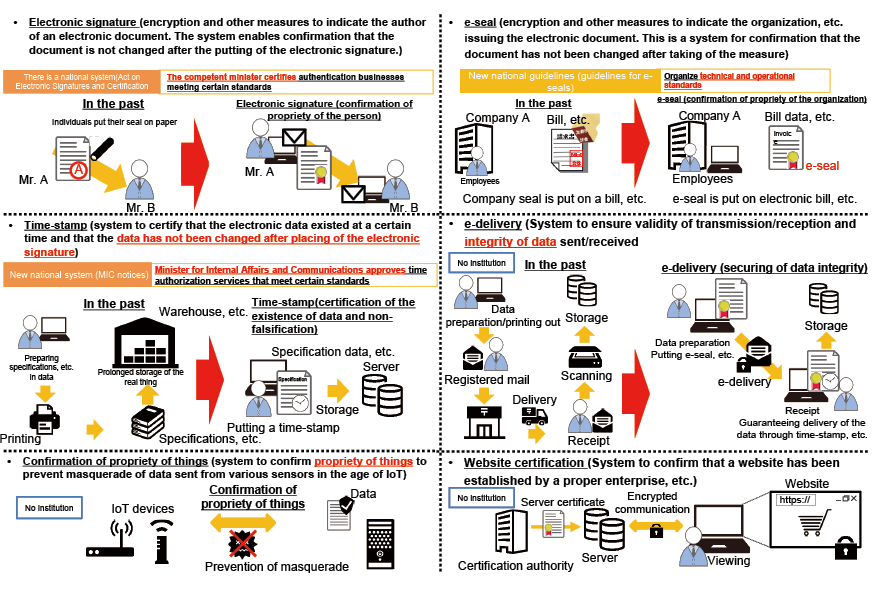
- Trust services | (Figure 5-5-2-1 in White Paper)
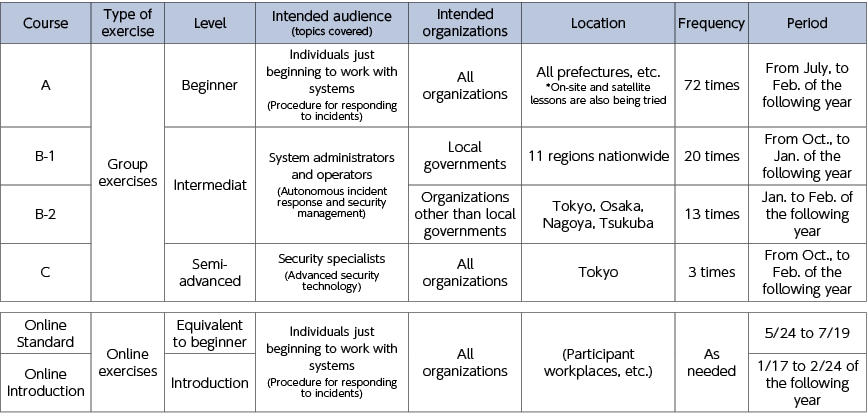
- Practical cyber defense exercises (CYDER: CYber Defense Exercise with Recurrence) | (Figure 5-5-3-1 in White Paper)
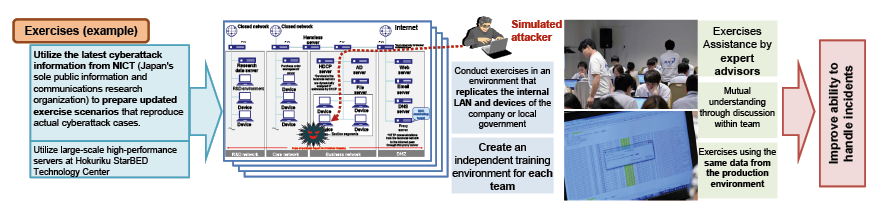
- CYDER in fiscal 2022 | (Figure 5-5-3-2 in White Paper)
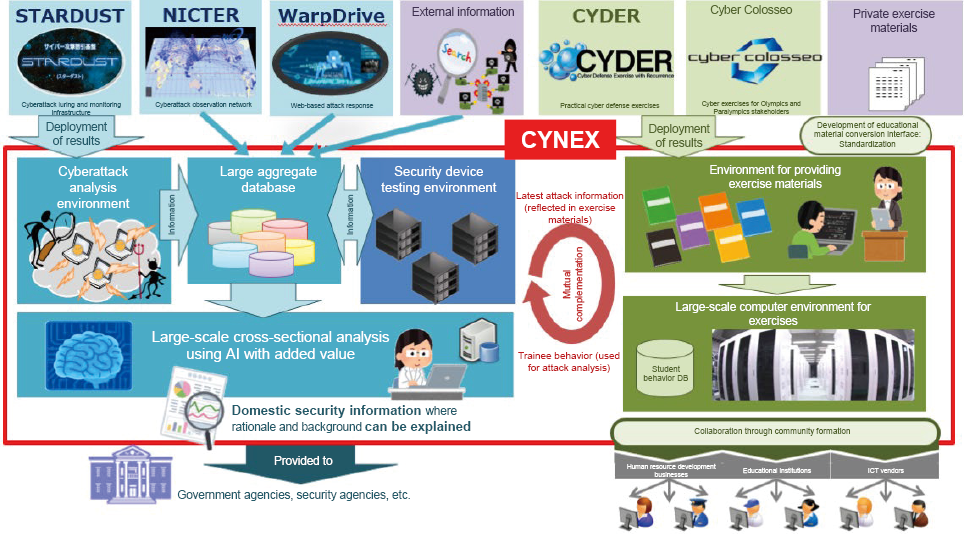
- Integrated cybersecurity knowledge/human resource development platform (CYNEX)
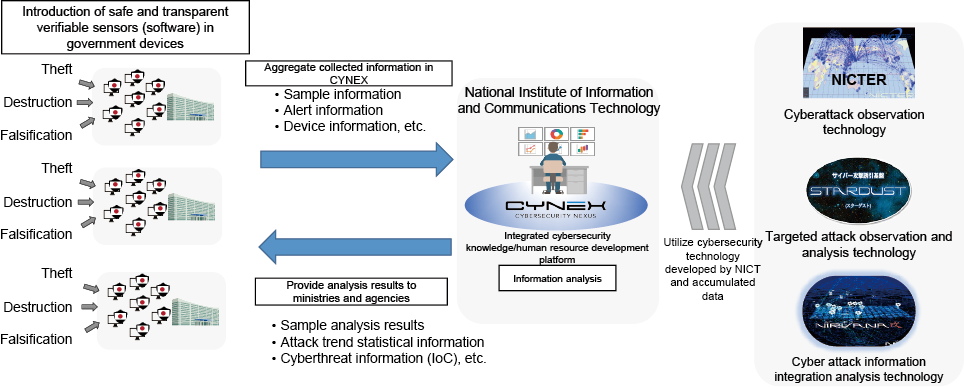
- Demonstration project for the collection and analysis of cybersecurity information using government device information (CYXROSS)
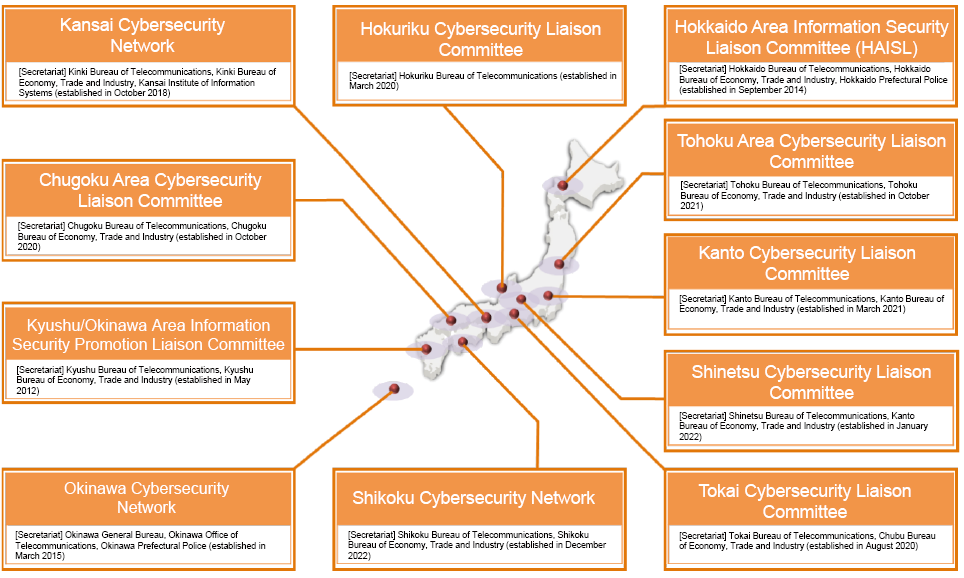
- Regional security communities
Chapter 5 - Section 7
- International competitiveness in the communications infrastructure market | (Figure 5-7-2-1 in White Paper)
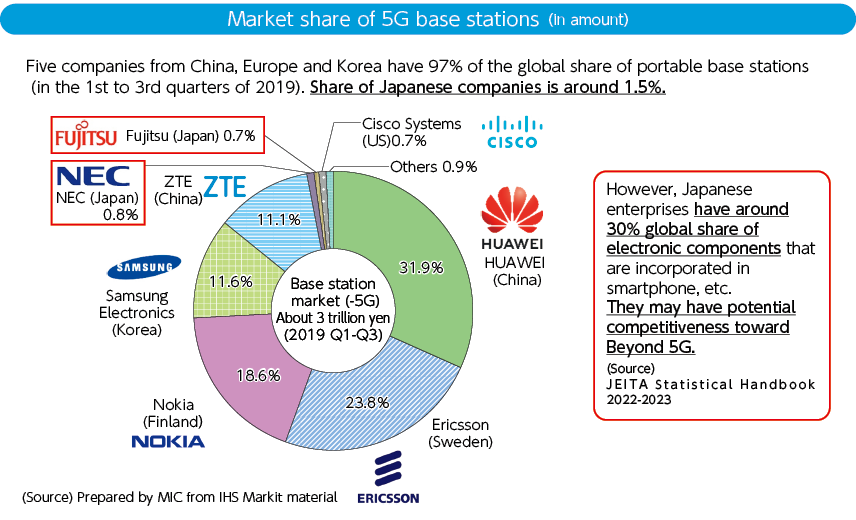
(Source) Prepared by MIC from IHS Markit material
- Beyond 5G (6G) R&D by the governments of other countries | (Figure 5-7-2-2 in White Paper)
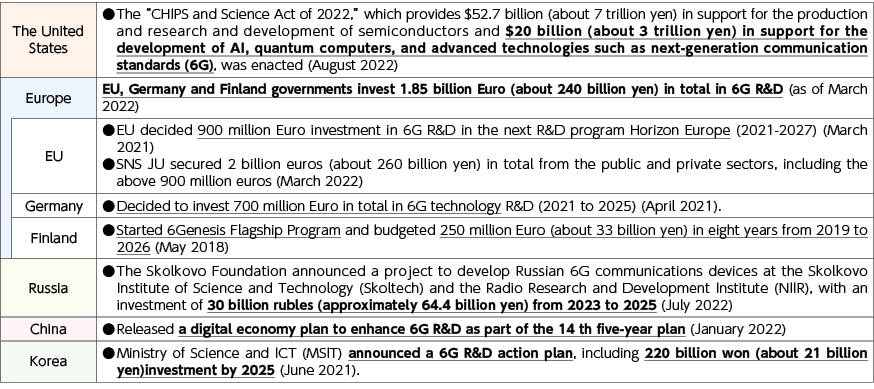
*The exchange rate at the time of publication was used for yen conversion.
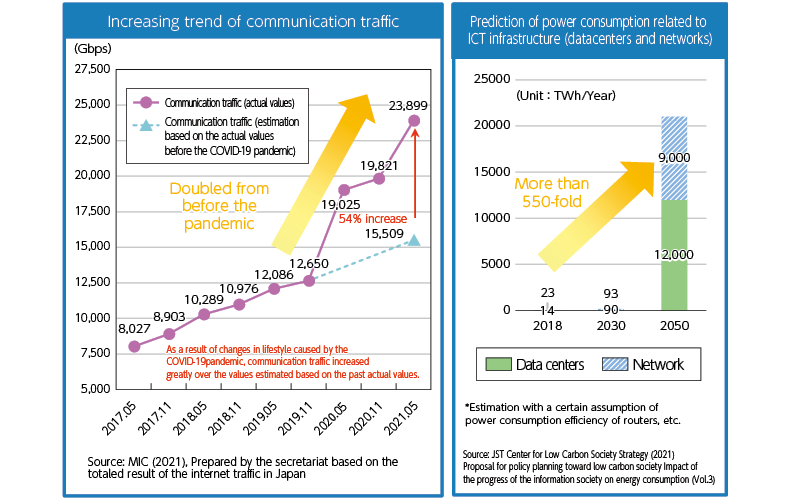
- Trends of communications traffic and energy consumption in the ICT field | (Figure 5-7-2-3 in White Paper)
- Strategy to accelerate research and development and social implementation of Beyond 5G (6G) | (Figure 5-7-2-4 in White Paper)
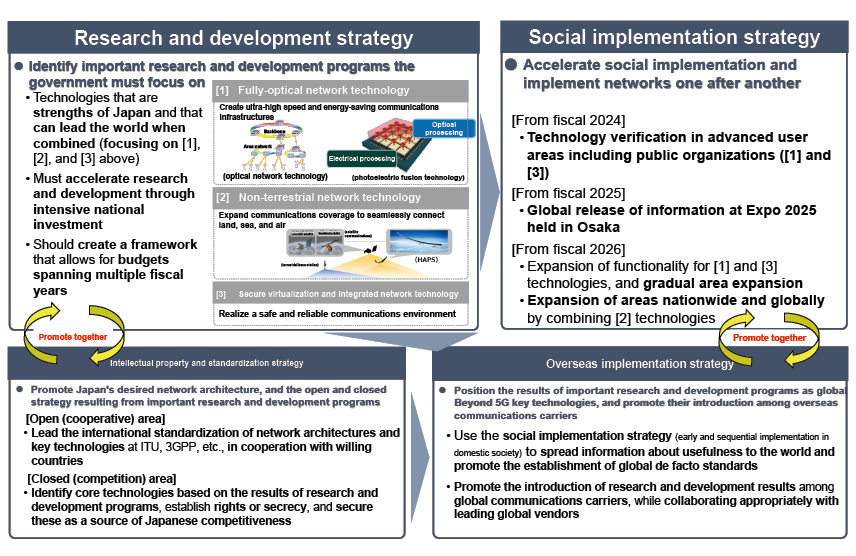
- Act Partially Amending the Act on the National Institute of Information and Communications Technology and Radio Act | (Figure 5-7-2-5 in White Paper)
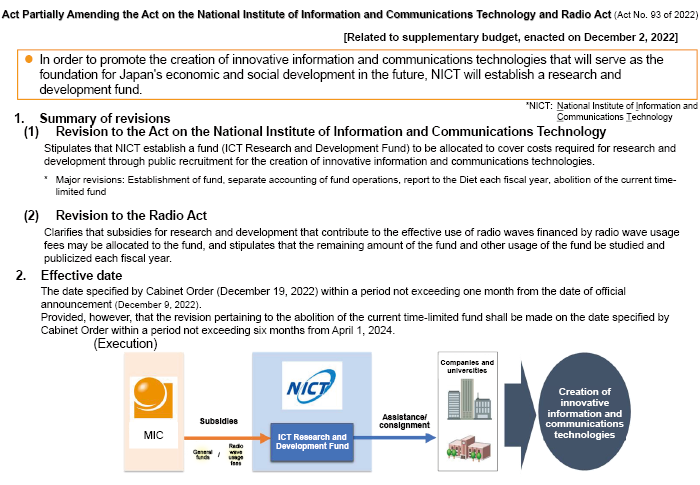
- Global quantum cryptographic communications network
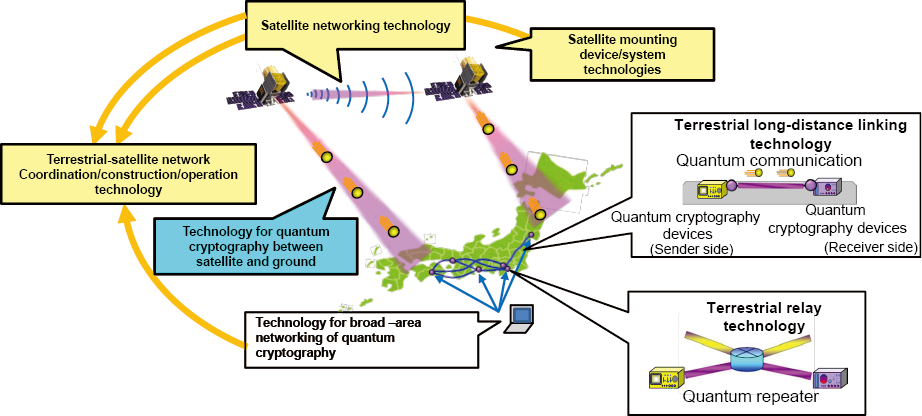
- Multilingual translation technology
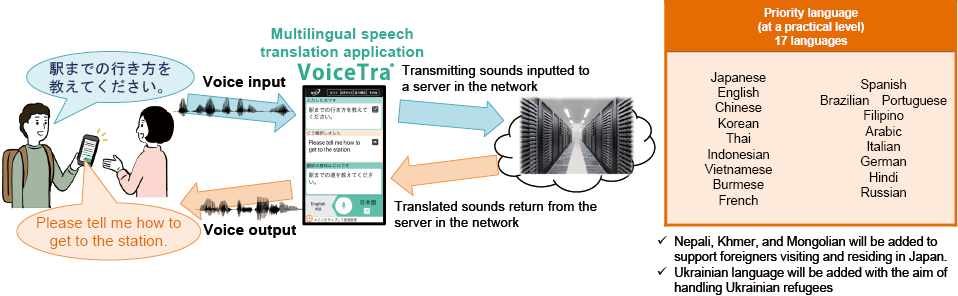
- Efforts to further advance multilingual translation technology
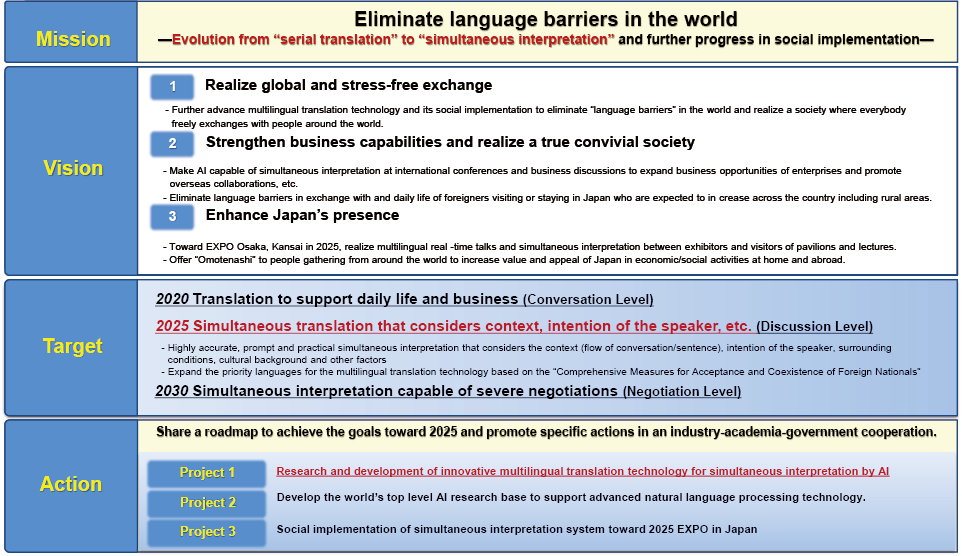
- Impact of solar flares on the Earth
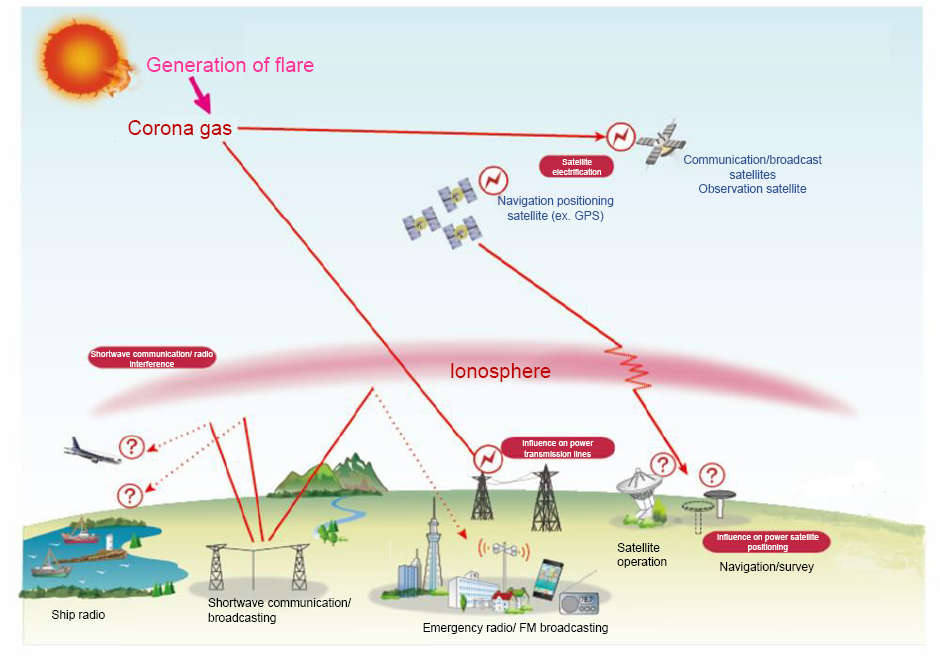
(Source) MIC, Material of the Study Group on the Advancement of Space Weather Forecasting (the 1st session)
Policy Focus 2
- Beyond 5G (6G) features
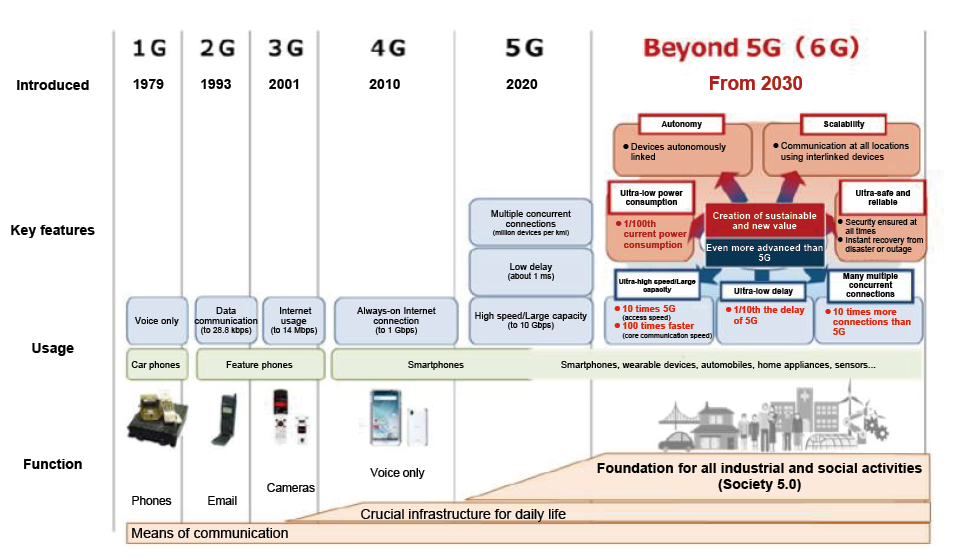
- Society of the 2030s realized through Beyond 5G (6G) | (Figure 1 in White Paper)
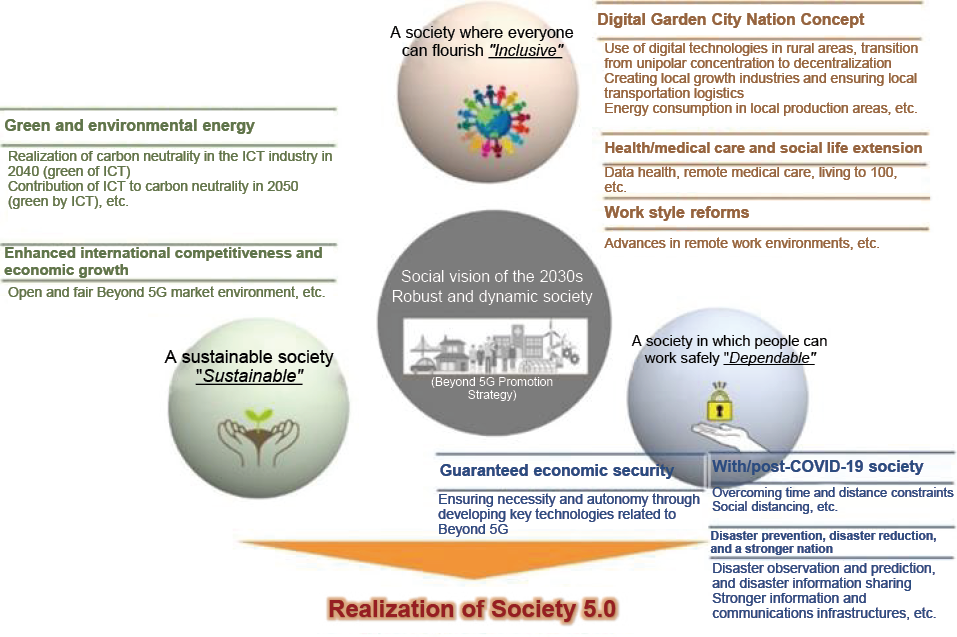
- Beyond 5G (6G) use cases | (Figure 2 in White Paper)
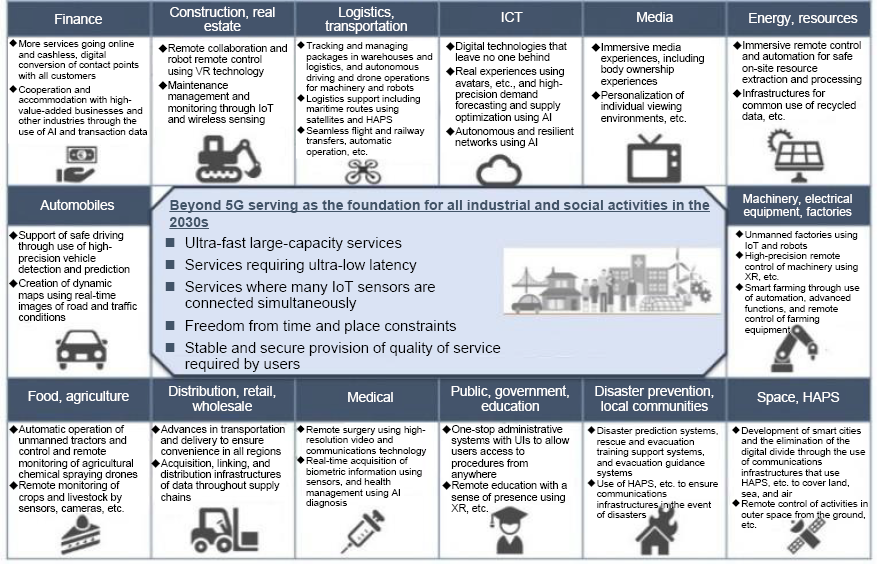
- Features and use scenes realized by Beyond 5G (6G) | (Figure 3 in White Paper)
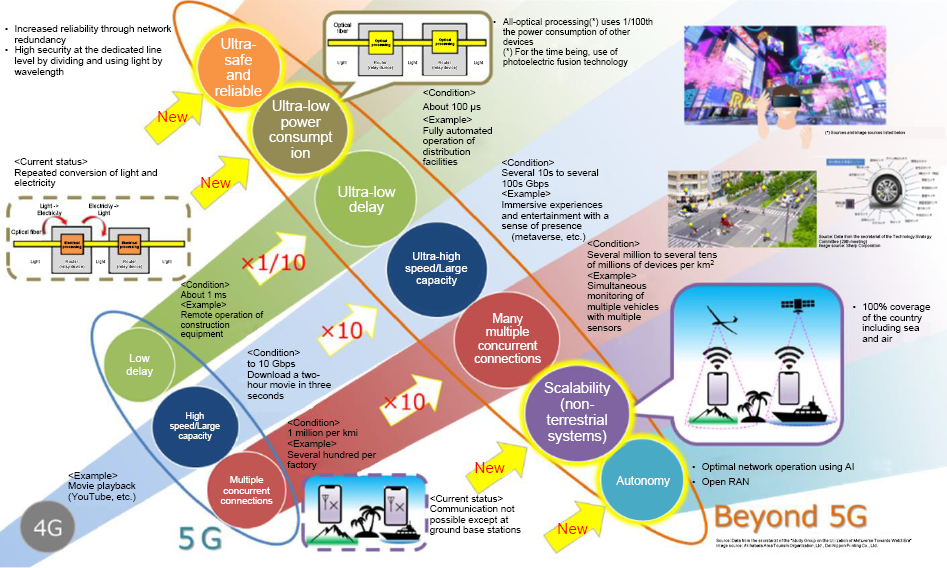
- Major challenges for Beyond 5G (6G) | (Figure 4 in White Paper)
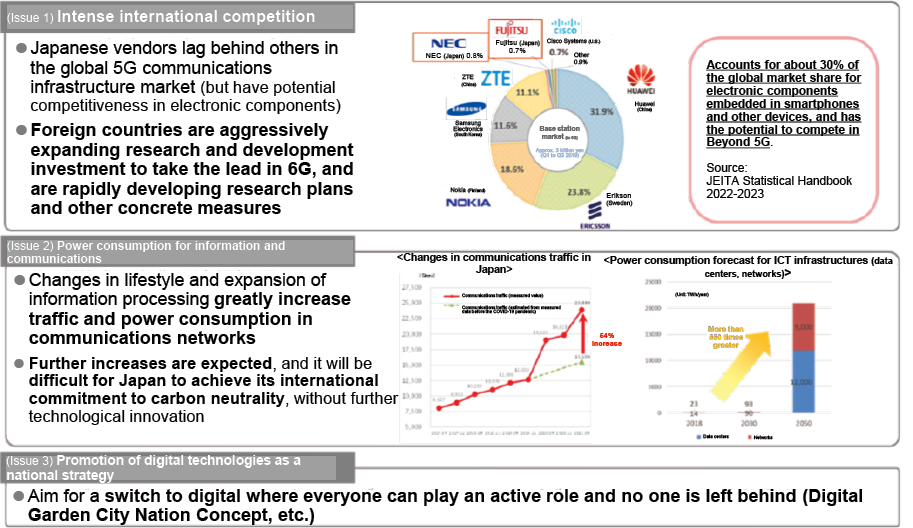
- The ideal Beyond 5G (6G) network
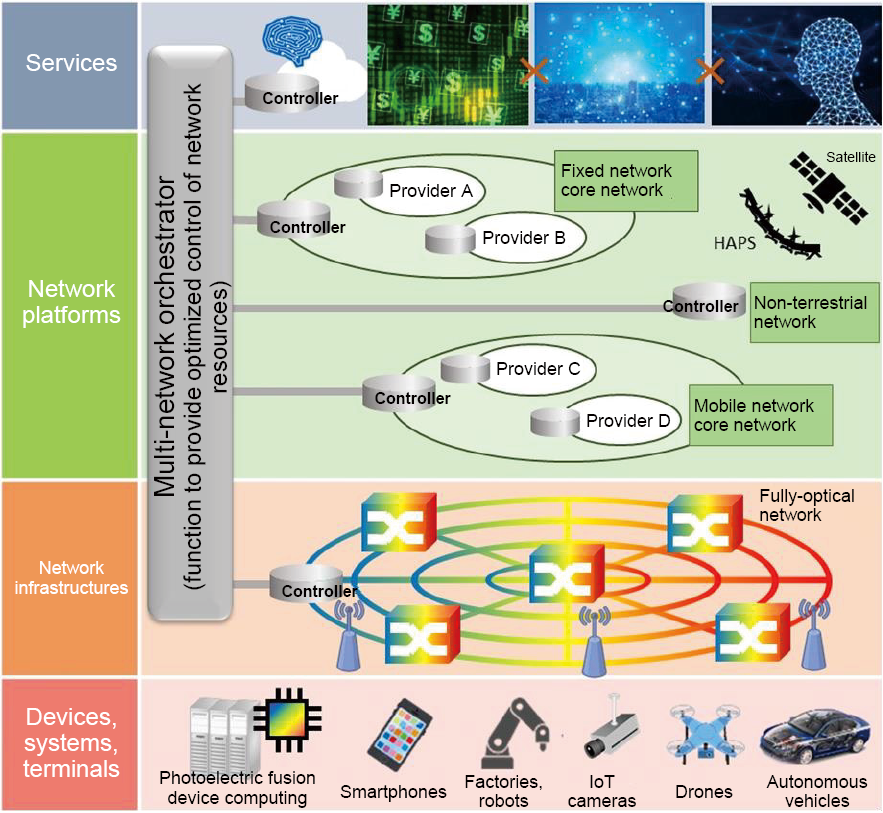
(Source) Information and Communications Council, Summary of the interim report on the “Information and Communications Technology Strategy for Beyond 5G”
- 10 Beyond 5G (6G) research and development issues for industry, academia, and government | (Figure 5 in White Paper)
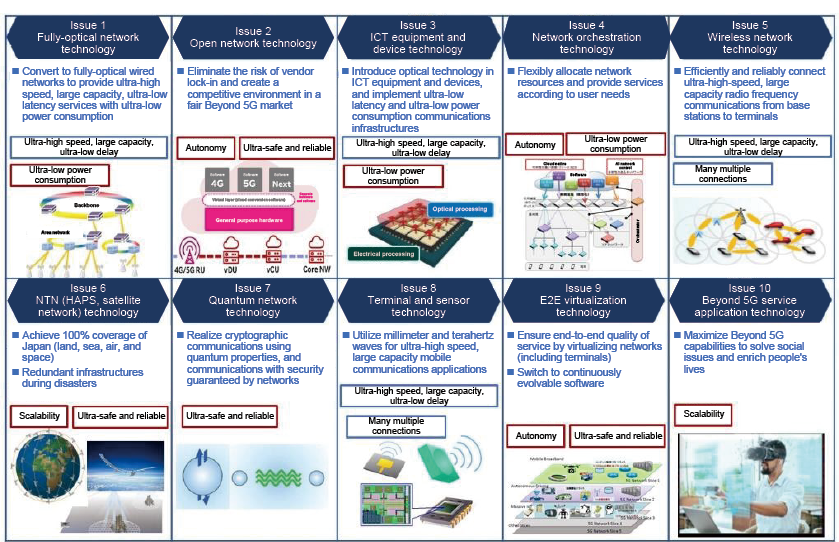
- Strategy to accelerate research and development and social implementation of Beyond 5G (6G)
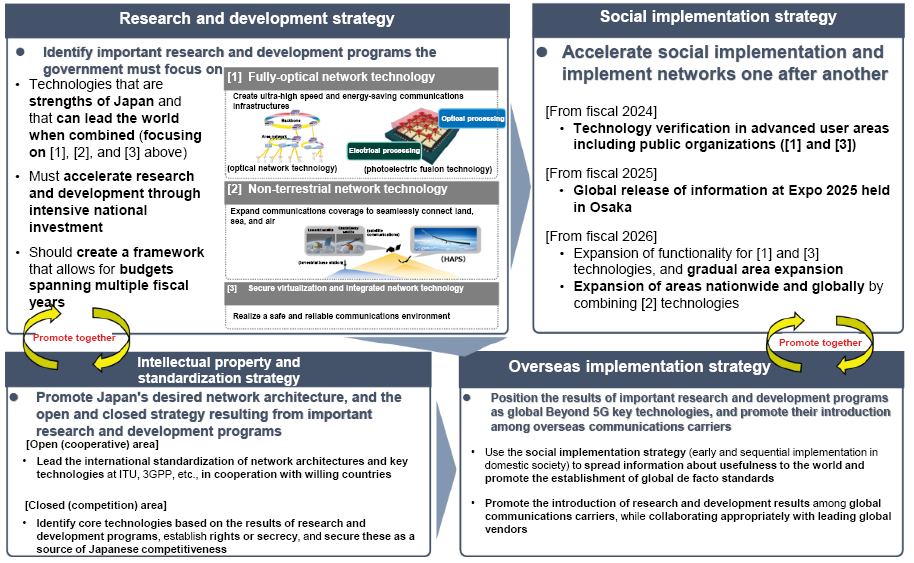
Chapter 5 - Section 8
- Japan Platform for Driving Digital Development | (Figure 5-8-2-1 in White Paper)
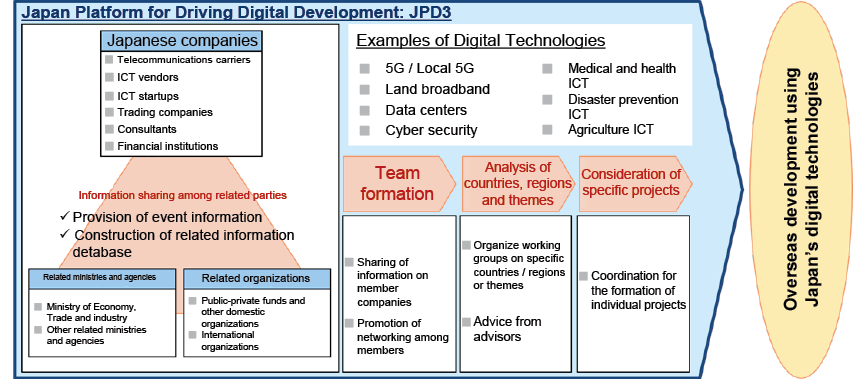
- Support through the Fund Corporation for the Overseas Development of Japan's ICT and Postal Services (JICT) | (Figure 5-8-2-2 in White Paper)
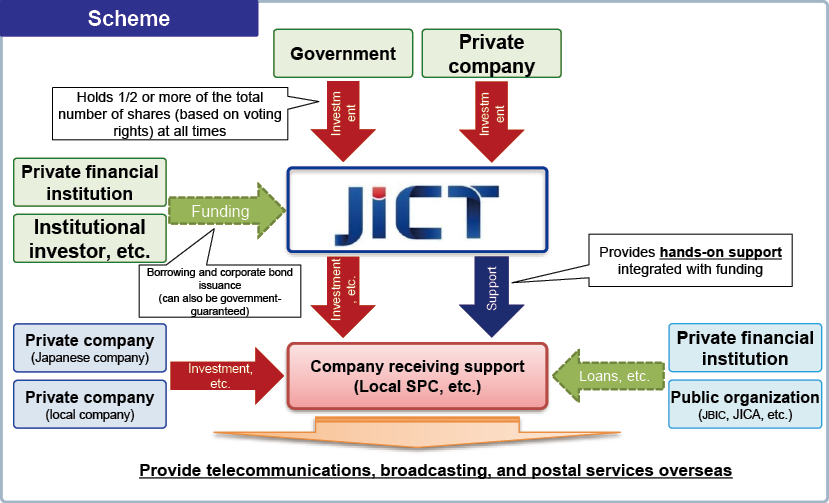
- Examples of overseas implementation of ICT | (Figure 5-8-2-3 in White Paper)
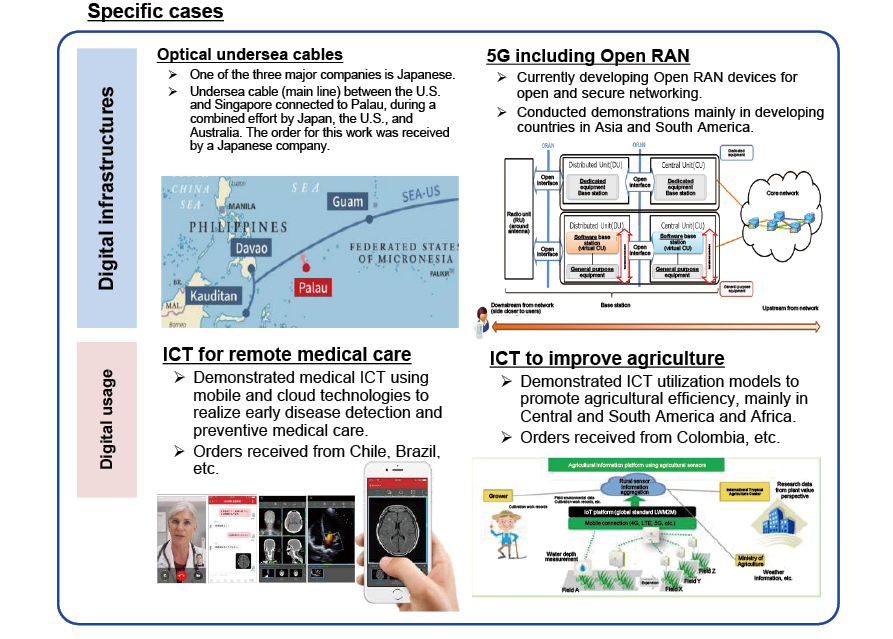
- History of G7/G20 ICT/digital discussions (overview) | (Figure 5-8-5-1 in White Paper)
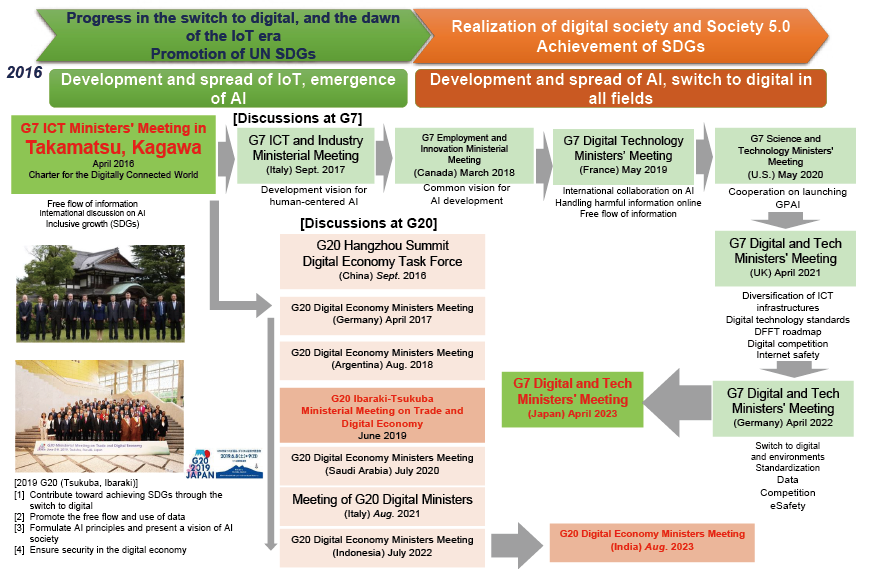
- International Telecommunication Union (ITU) organization | (Figure 5-8-5-2 in White Paper)
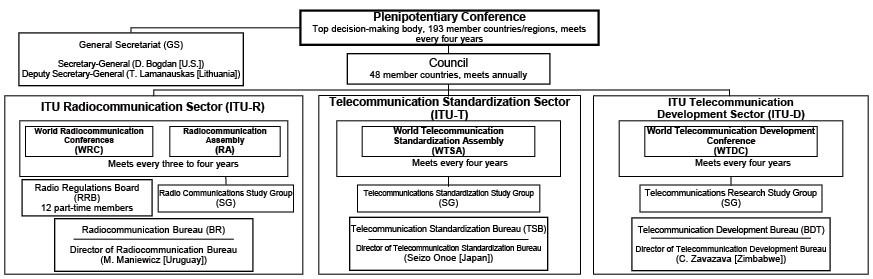
- Global Digital Connectivity Partnership (GDCP) | (Figure 5-8-6-1 in White Paper)
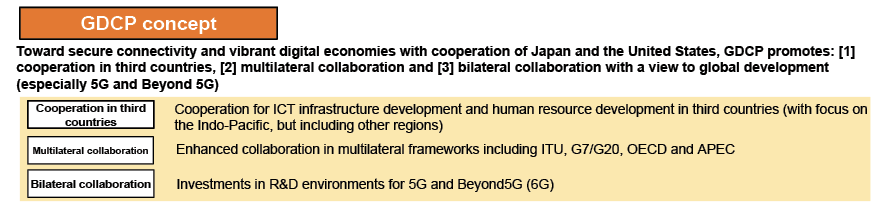
Policy Focus 3
- G7 Summit and related ministerial meetings | (Figure 1 in White Paper)
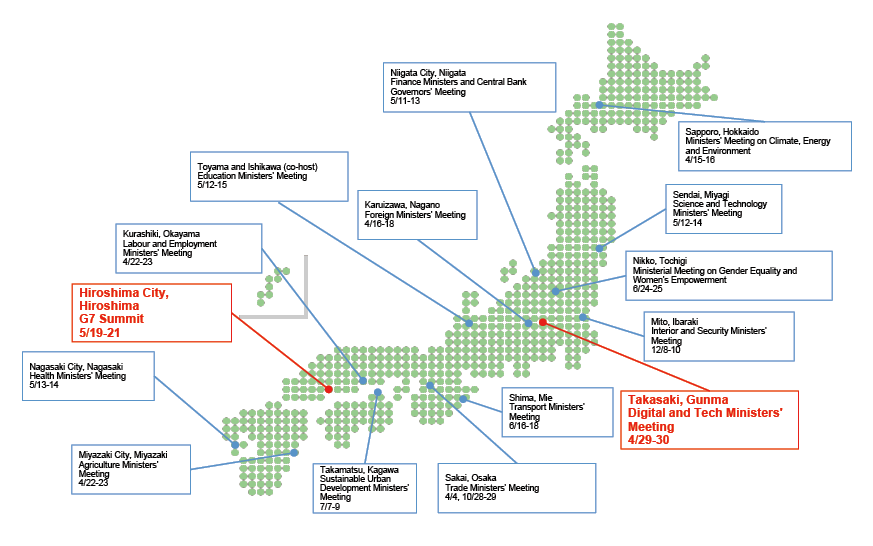
- G7 Digital and Tech Ministers' Meeting in Takasaki, Gunma | (Figure 2 in White Paper)
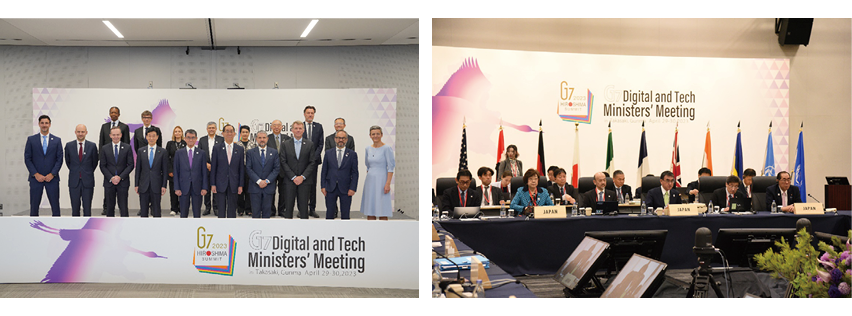
Chapter 5 - Section 9
- Post office-style kiosk terminal | (Figure 5-9-2-1 in White Paper)
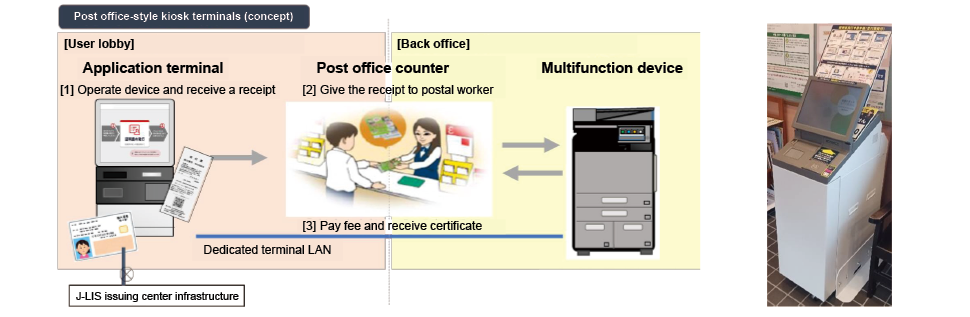
- Project to Promote Cooperation between Post Offices and Public Regional Infrastructures | (Figure 5-9-2-2 in White Paper)
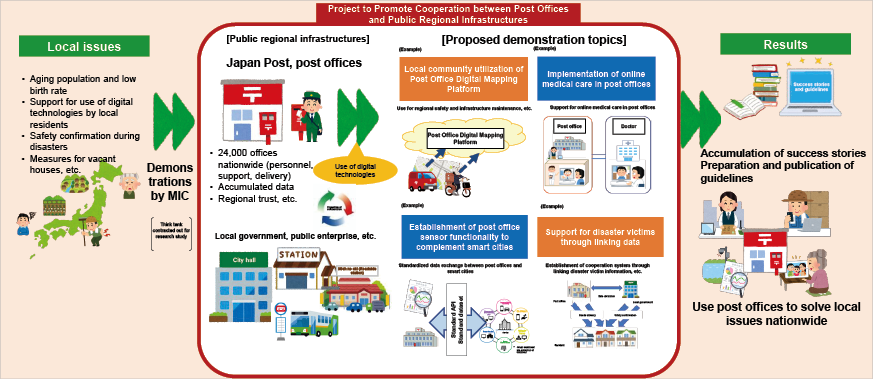
- Regional demonstrations | (Figure 5-9-2-3 in White Paper)
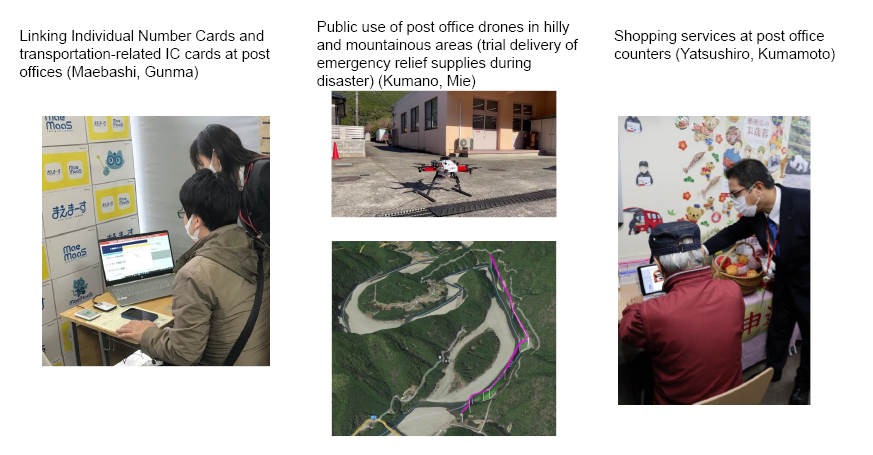
(Source) Lower center image: Created by ACSL Ltd. with Google Earth (Map data © 2022 Google)